Charts · perception · communication

Data Lens.

Small observations about charts, data and how we see information.

Today’s Data Lens

29 October 2026
One-minute observation

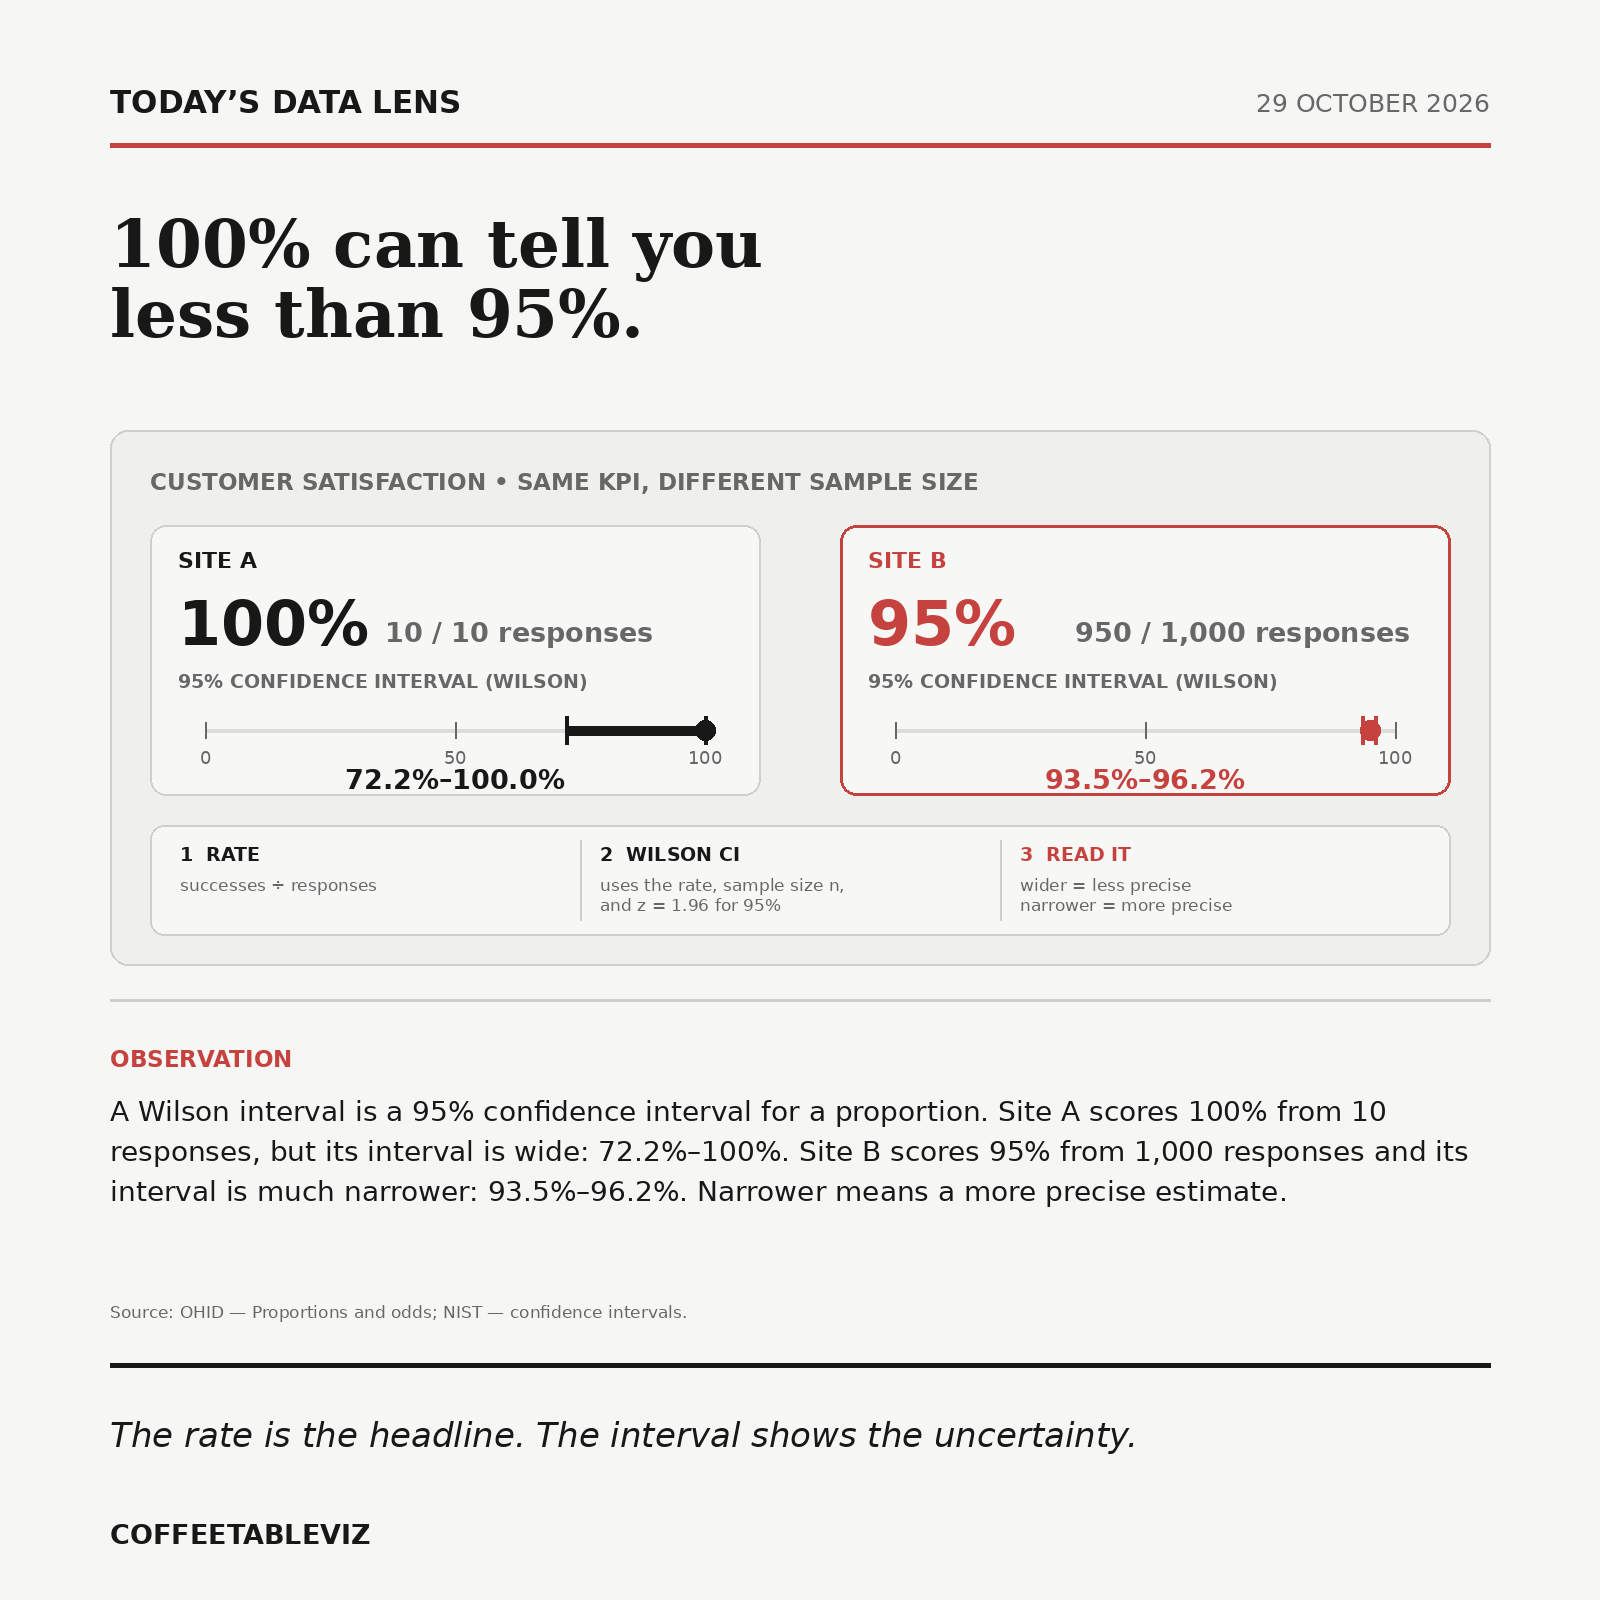
100% can tell you less than 95%.

Read the edition →

Archive

19 editions
29 Oct 100% can tell you less than 95%. Data Lens 23 Oct The average kept rising six days after the peak. Data Lens 17 Oct On a log scale, doubling travels the same distance. Data Lens 16 Oct Missing is not zero. Data Lens 14 Oct 30% rain does not mean 18 wet minutes. Data Lens 13 Oct One place meant 1 point. The next meant 18. Data Lens 8 Oct The band gets thinner because the army did. Data Lens 4 Oct Ten years shouldn’t look like one. Data Lens 3 Oct Position beats area. Data Lens 1 Oct A highlight needs something to fade. Data Lens 30 Sep Some lines should use stairs. Data Lens 28 Sep Put the name next to the line. Data Lens 27 Sep Same bars. Better order. Data Lens 25 Sep A bar needs zero. Data Lens 23 Sep One outlier moved the mean. The median stayed put. Data Lens 22 Sep Same summary. Four different shapes. Data Lens 21 Sep Five points is not five per cent Data Lens 20 Sep Same data. Different bins. Different story. Data Lens 19 Sep A dot can do the bar’s job — with less ink. Data Lens