Data · design · storytelling
Find the interesting bit.
Show it simply.
Short visual stories about sport, culture and everyday numbers. Built from real data, with the charts doing most of the talking.
Latest story
10 September 2026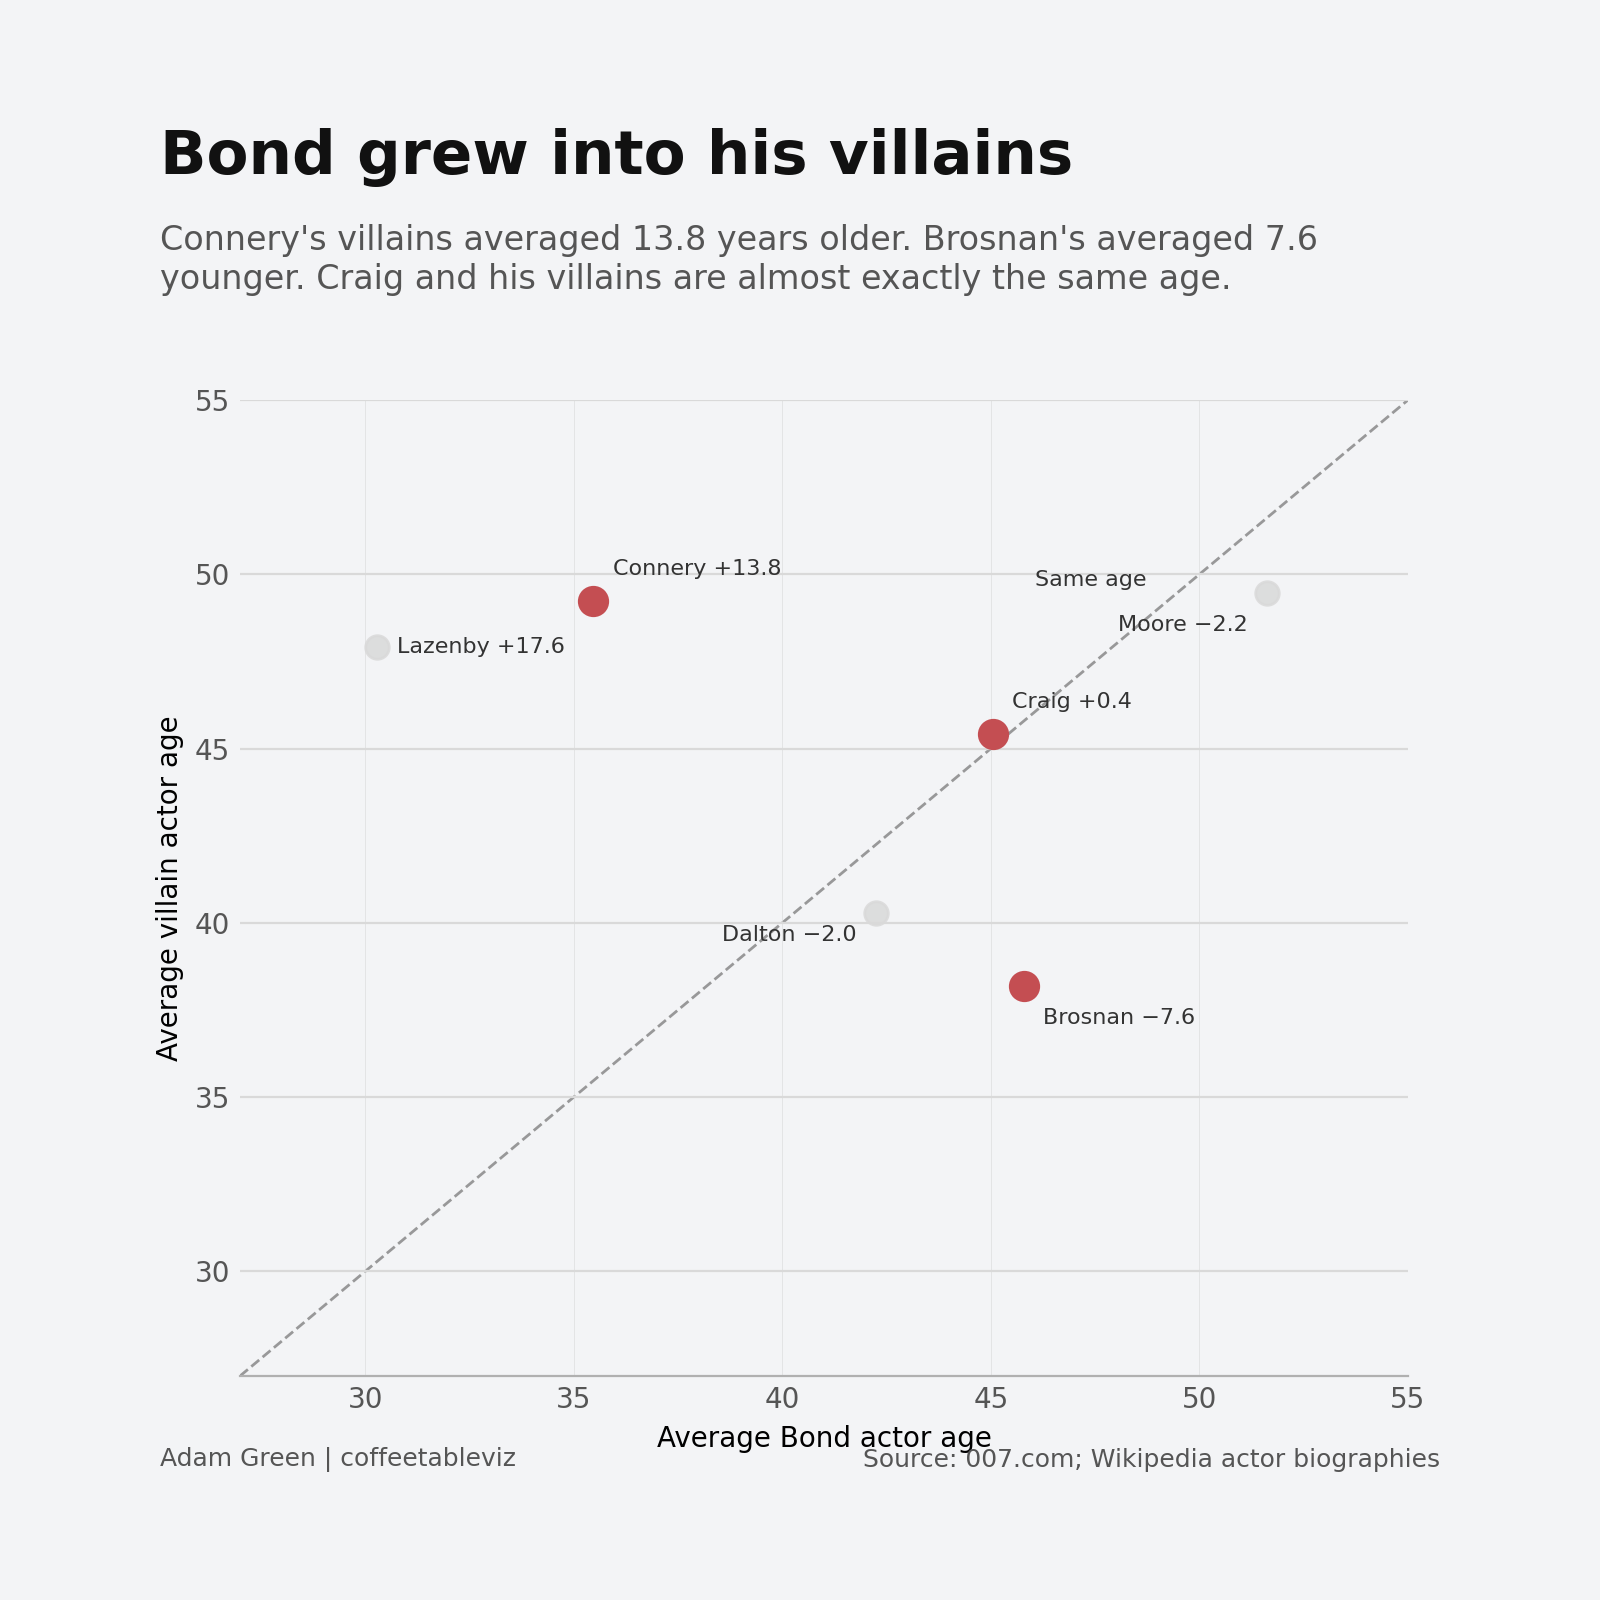
Film
Bond finally grew into his villains
Bond villains did not simply get younger. Bond mostly caught up.
Read the storyHow stories are built
01
Start with the data
Inspect it, test it and resist the tempting story if the evidence points elsewhere.
02
Build the reveal
Set the scene, add the tension, then land one clear aha moment.
03
Keep the receipts
Data, chart configuration, output and article live together in one provenance trail.