TODAY’S DATA LENS
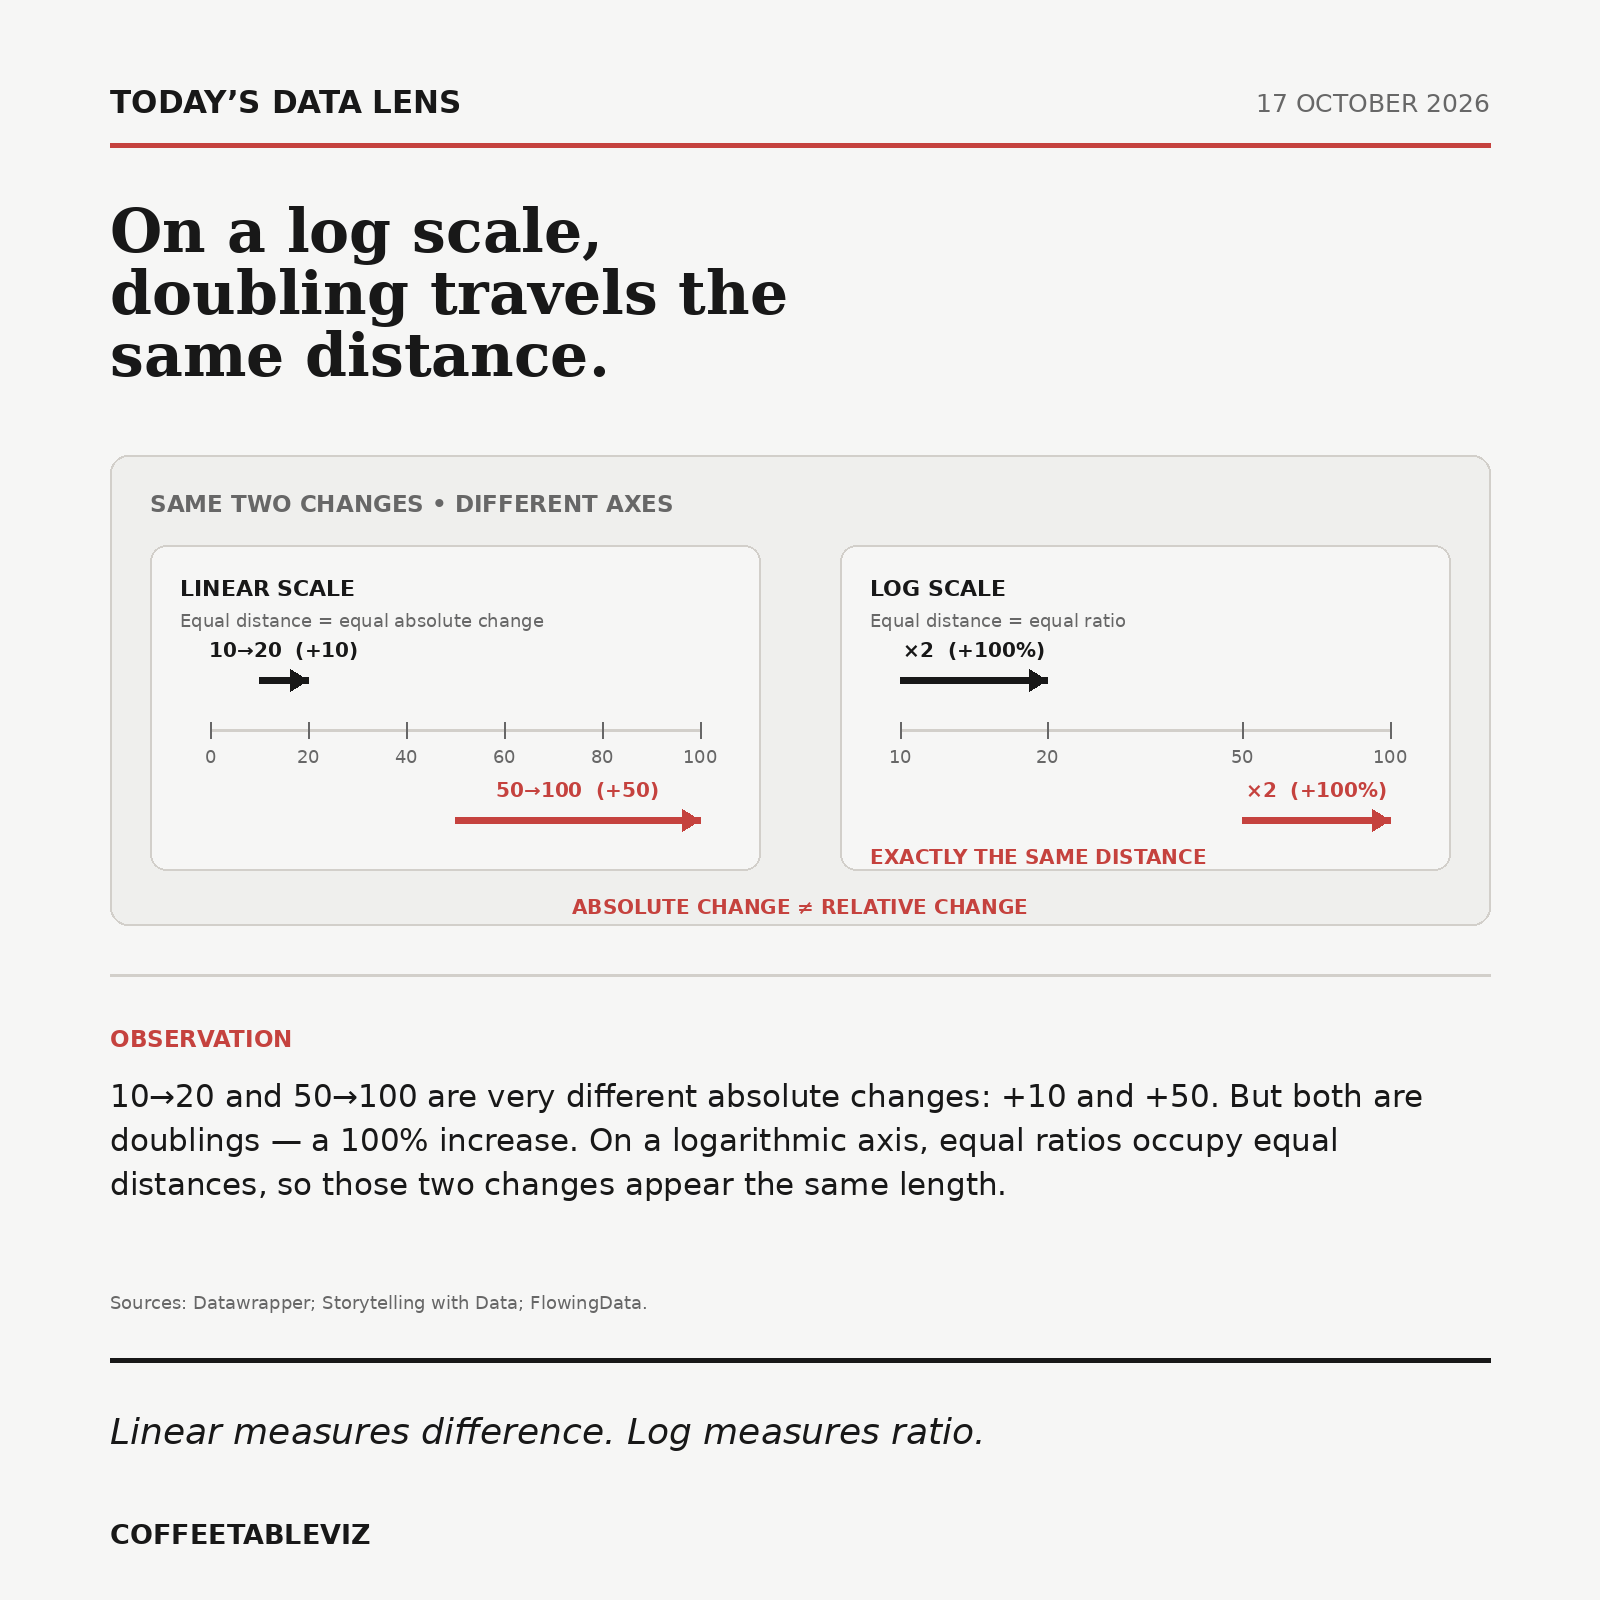
On a log scale, doubling travels the same distance.
A little further
Log scales are useful when the relative change matters more than the raw difference, particularly when values span a very wide range. A good example is comparing growth across businesses or populations of very different sizes: moving from 10 to 20 and from 1,000 to 2,000 are both doublings, even though their absolute increases are nowhere near the same.
They’re also useful for spotting sustained percentage growth in a time series, because equal growth rates produce similar slopes. The trade-off is unfamiliarity — and zero cannot appear on a logarithmic axis. A useful check is: am I trying to compare ratios, or actual differences?
Linear measures difference. Log measures ratio.