TODAY’S DATA LENS
100% can tell you less than 95%.
A little further
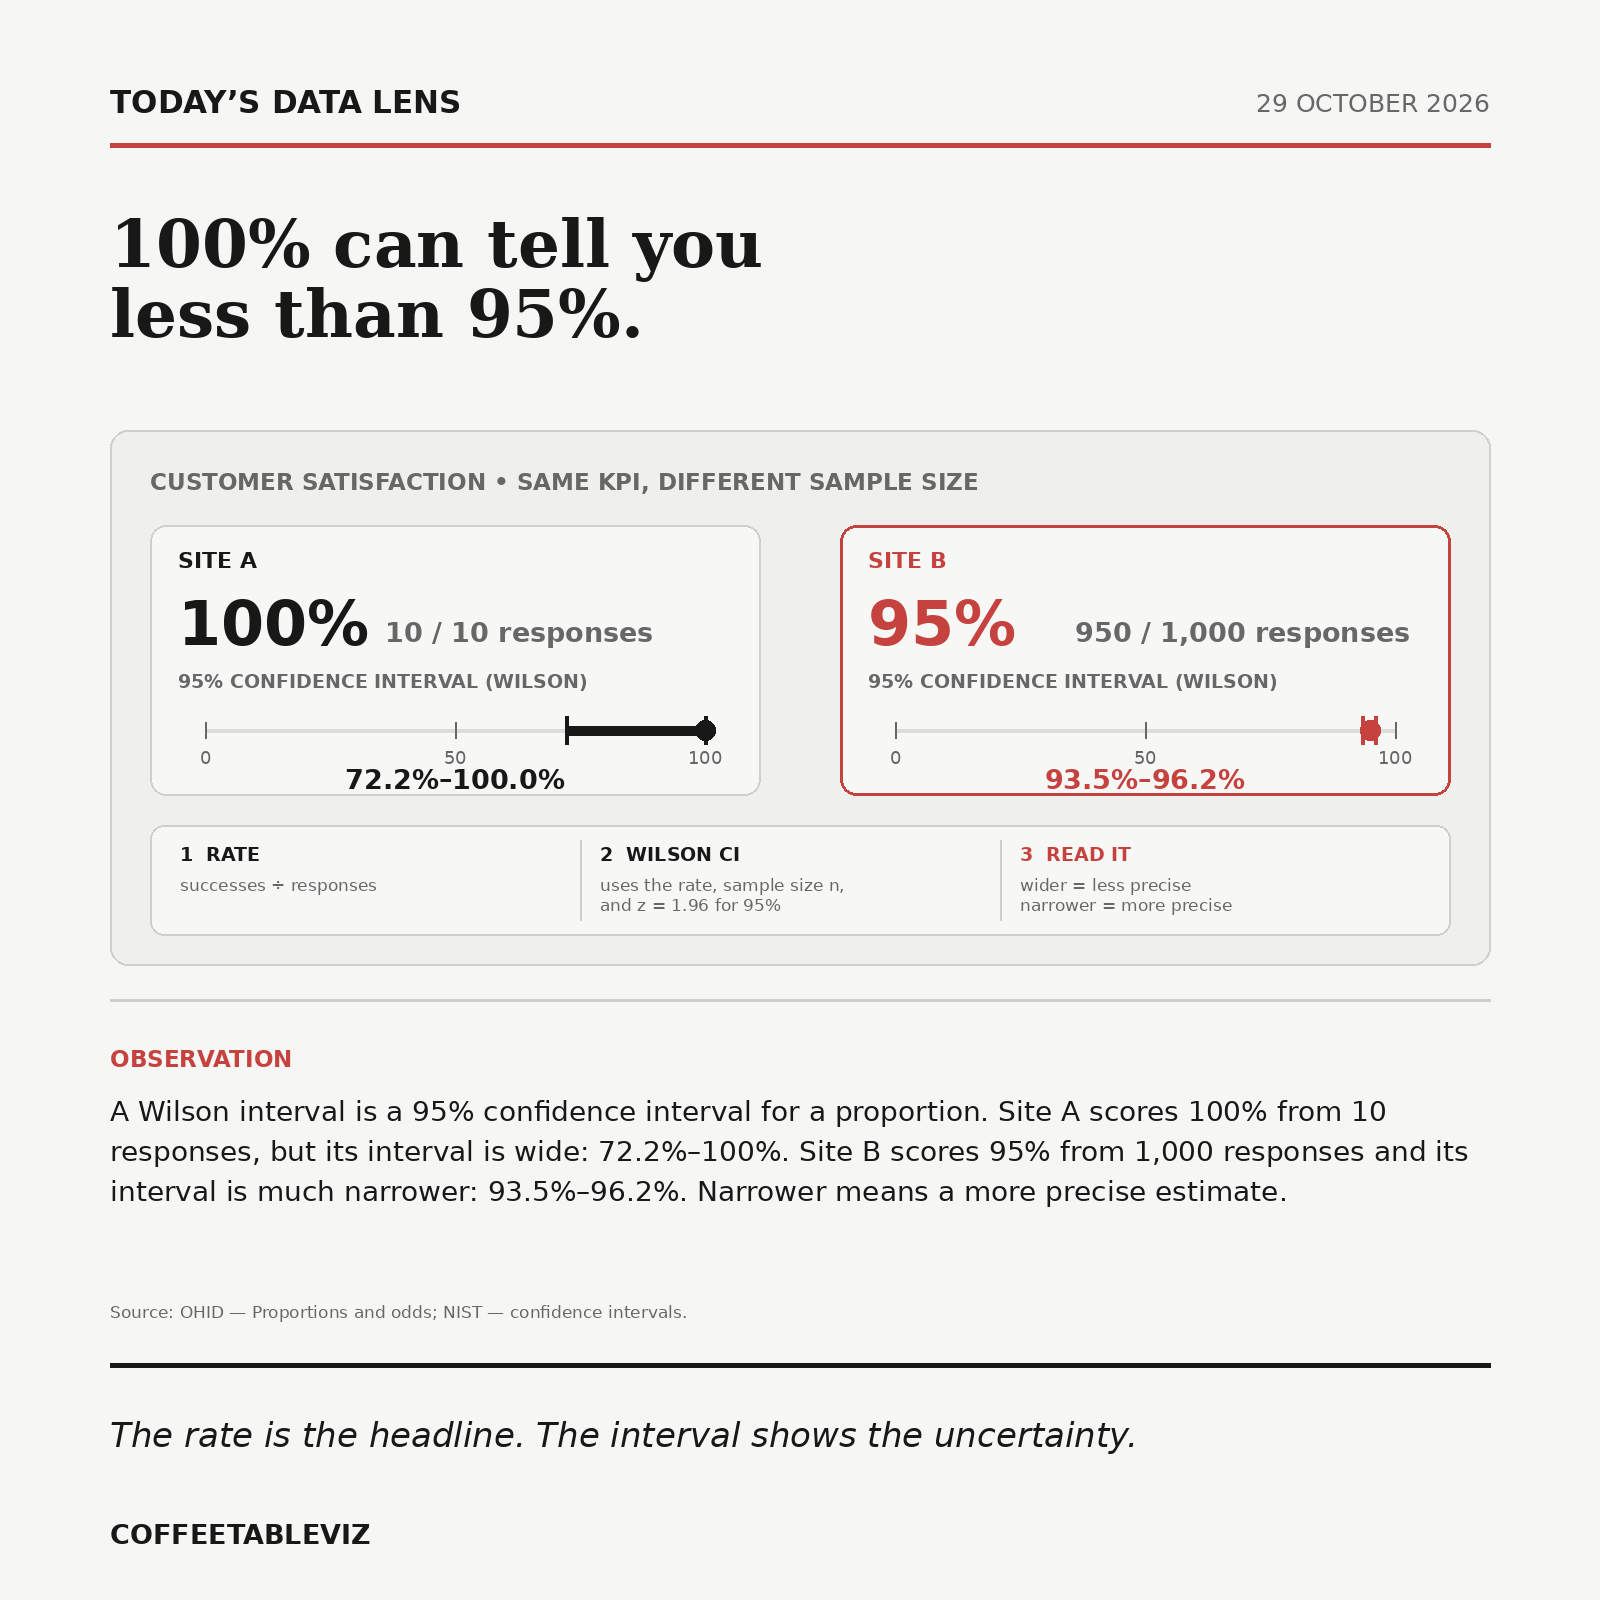
A Wilson interval is a confidence interval for a proportion. It starts with the observed rate — successes divided by responses — then adjusts the centre and width using the sample size and the chosen confidence level. For a 95% interval, the calculation uses a standard-normal value of 1.96.
The important bit is how to read it. A wide interval means the estimate is relatively imprecise; a narrow one means much more evidence sits behind the headline percentage. It does not mean there is a 95% probability that the true rate lies inside this particular interval.
That is why showing the denominator alongside a rate can materially change how convincing the KPI feels.
The rate is the headline. The interval shows the uncertainty.