TODAY’S DATA LENS
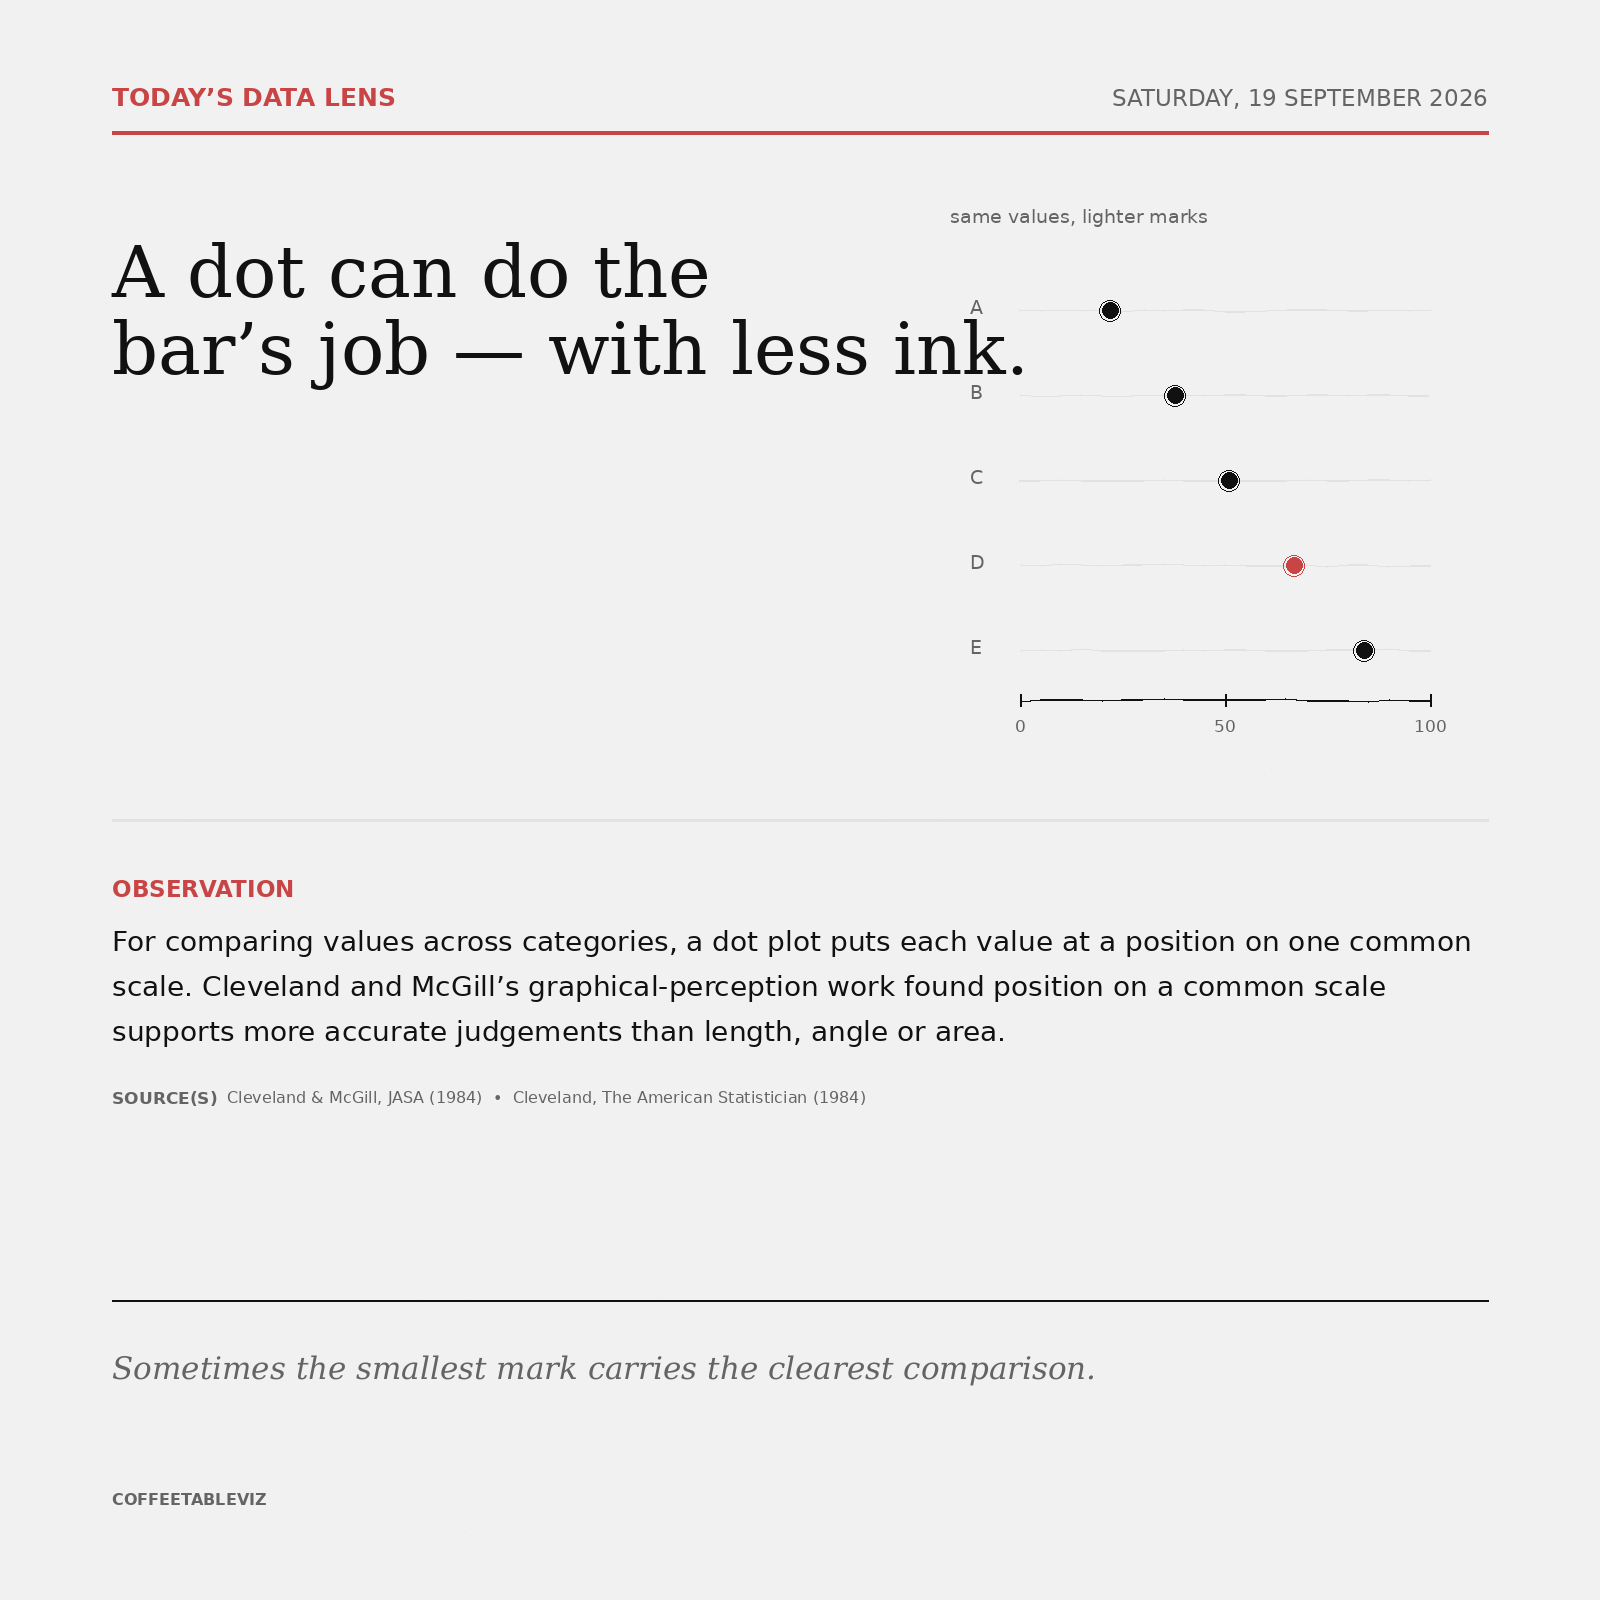
A dot can do the bar’s job — with less ink.
Observation
For comparing values across categories, a dot plot puts each value at a position on one common scale. Cleveland and McGill’s graphical-perception work found position on a common scale supports more accurate judgements than length, angle or area.
Sometimes the smallest mark carries the clearest comparison.