TODAY’S DATA LENS
Ten years shouldn’t look like one.
Observation
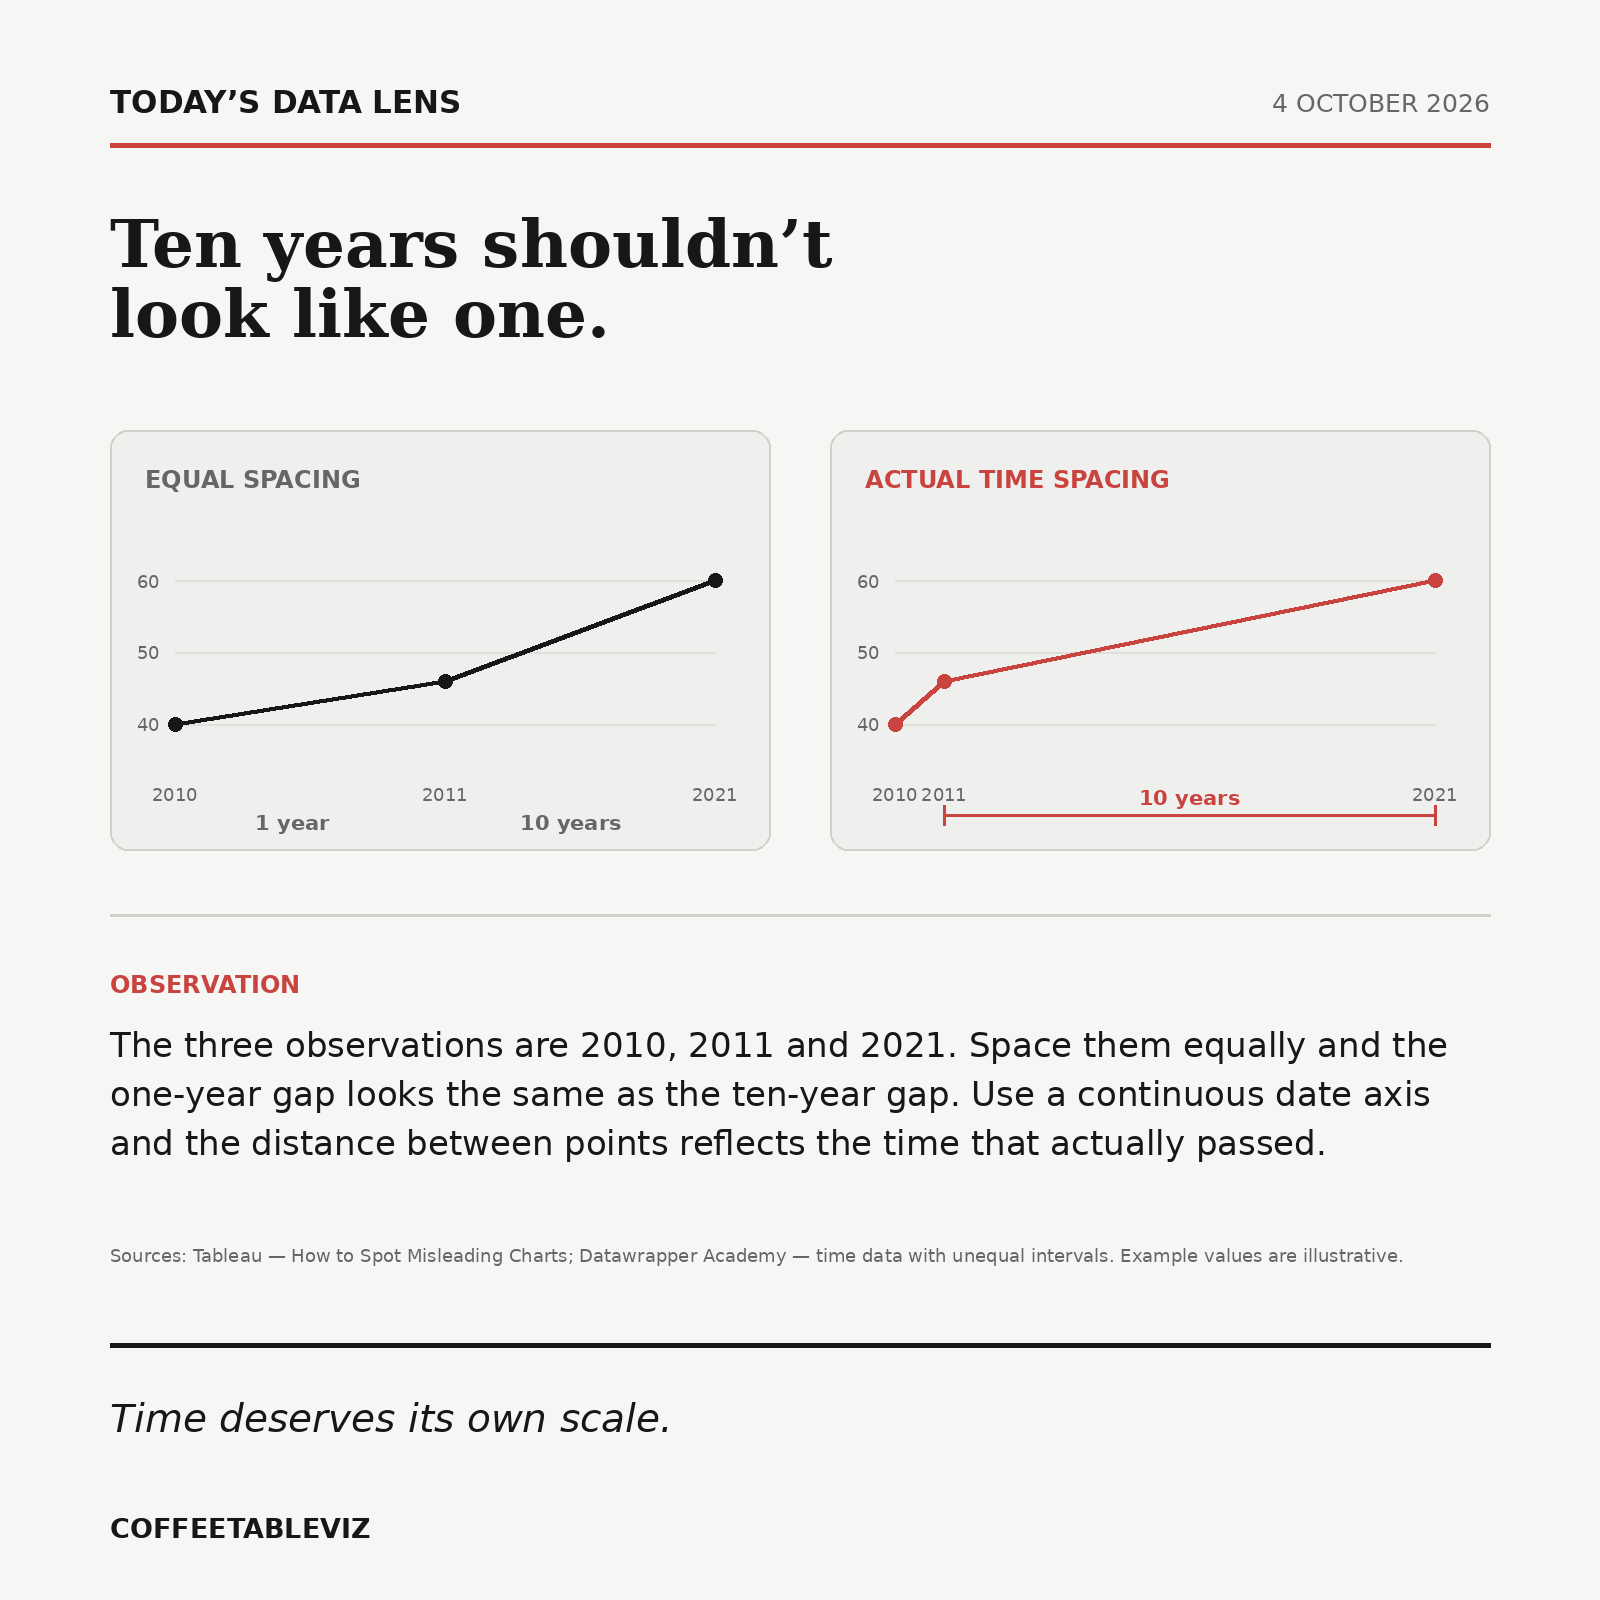
The three observations are 2010, 2011 and 2021. Space them equally and the one-year gap looks the same as the ten-year gap. Use a continuous date axis and the distance between points reflects the time that actually passed.
Time deserves its own scale.