TODAY’S DATA LENS
A bar needs zero.
Observation
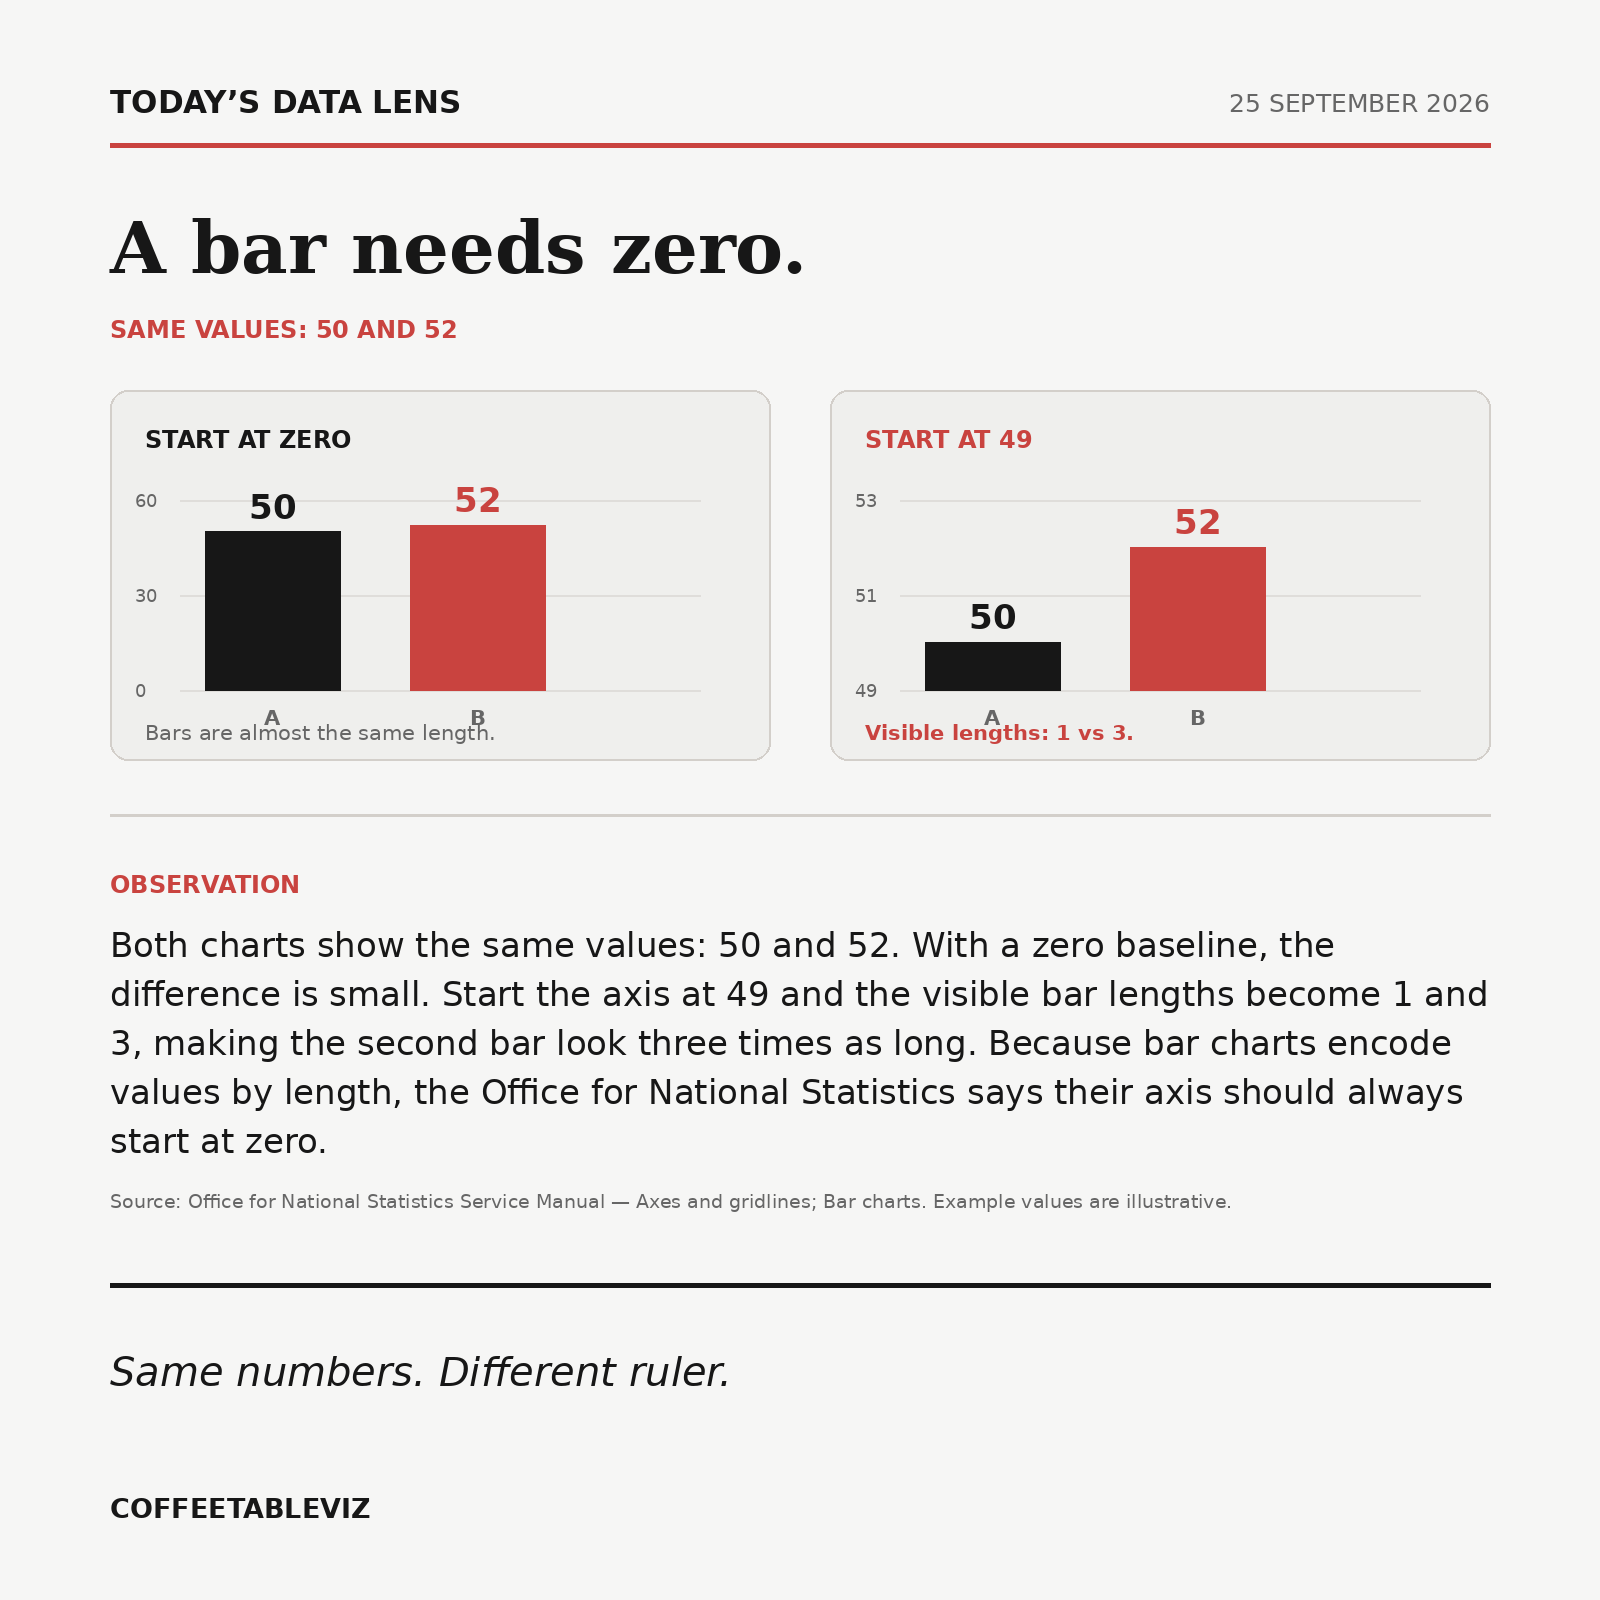
Both charts show the same values: 50 and 52. With a zero baseline, the difference is small. Start the axis at 49 and the visible bar lengths become 1 and 3, making the second bar look three times as long. Because bar charts encode values by length, the Office for National Statistics says their axis should always start at zero.
Same numbers. Different ruler.