TODAY’S DATA LENS
Same summary. Four different shapes.
Observation
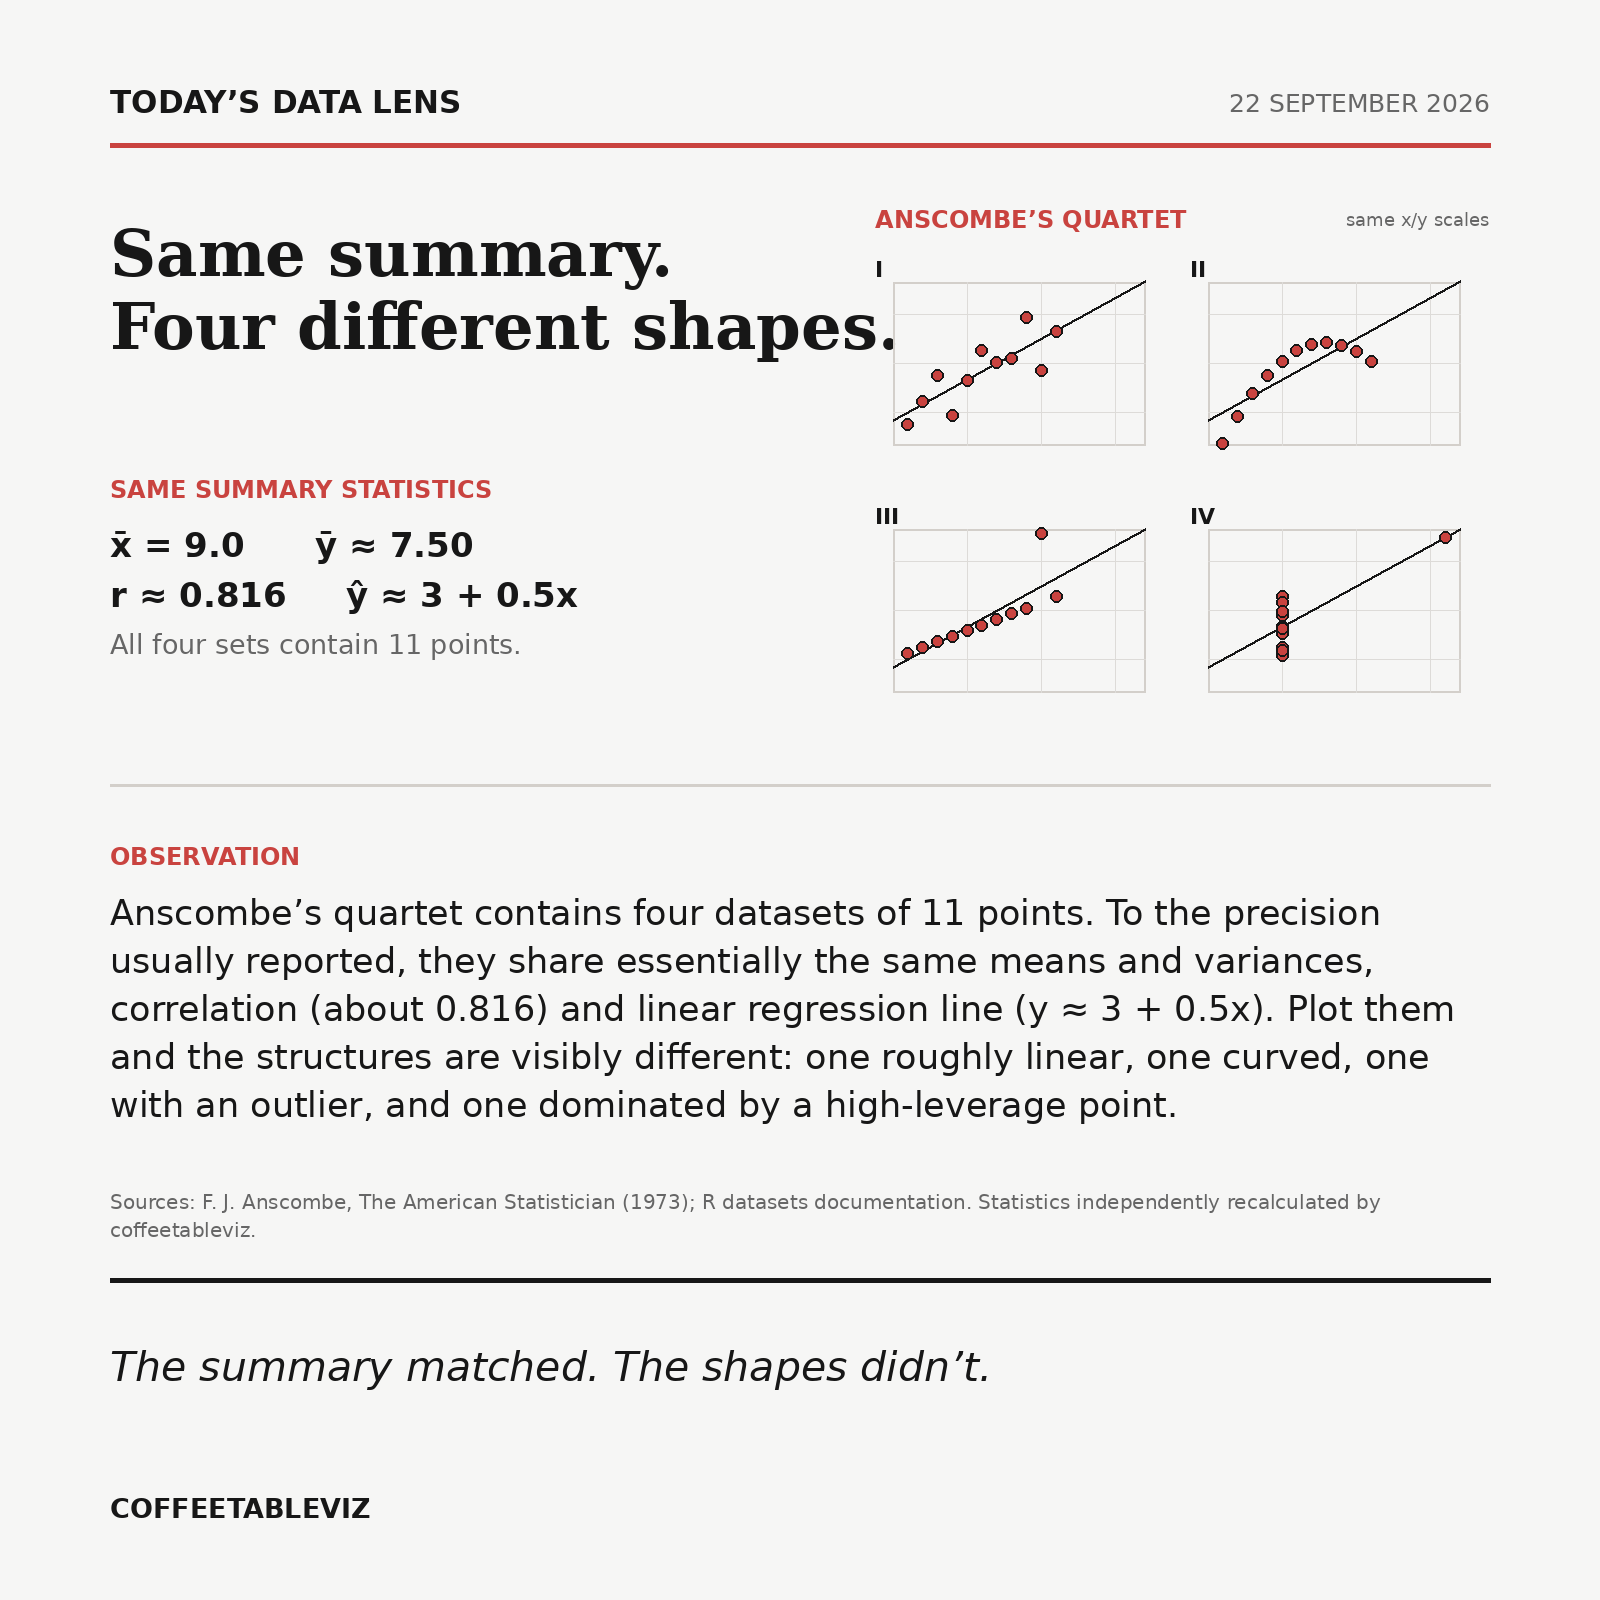
Anscombe’s quartet contains four datasets of 11 points. To the precision usually reported, they share essentially the same means and variances, correlation (about 0.816) and linear regression line (y ≈ 3 + 0.5x). Plot them and the structures are visibly different: one roughly linear, one curved, one with an outlier, and one dominated by a high-leverage point.
The summary matched. The shapes didn’t.