TODAY’S DATA LENS
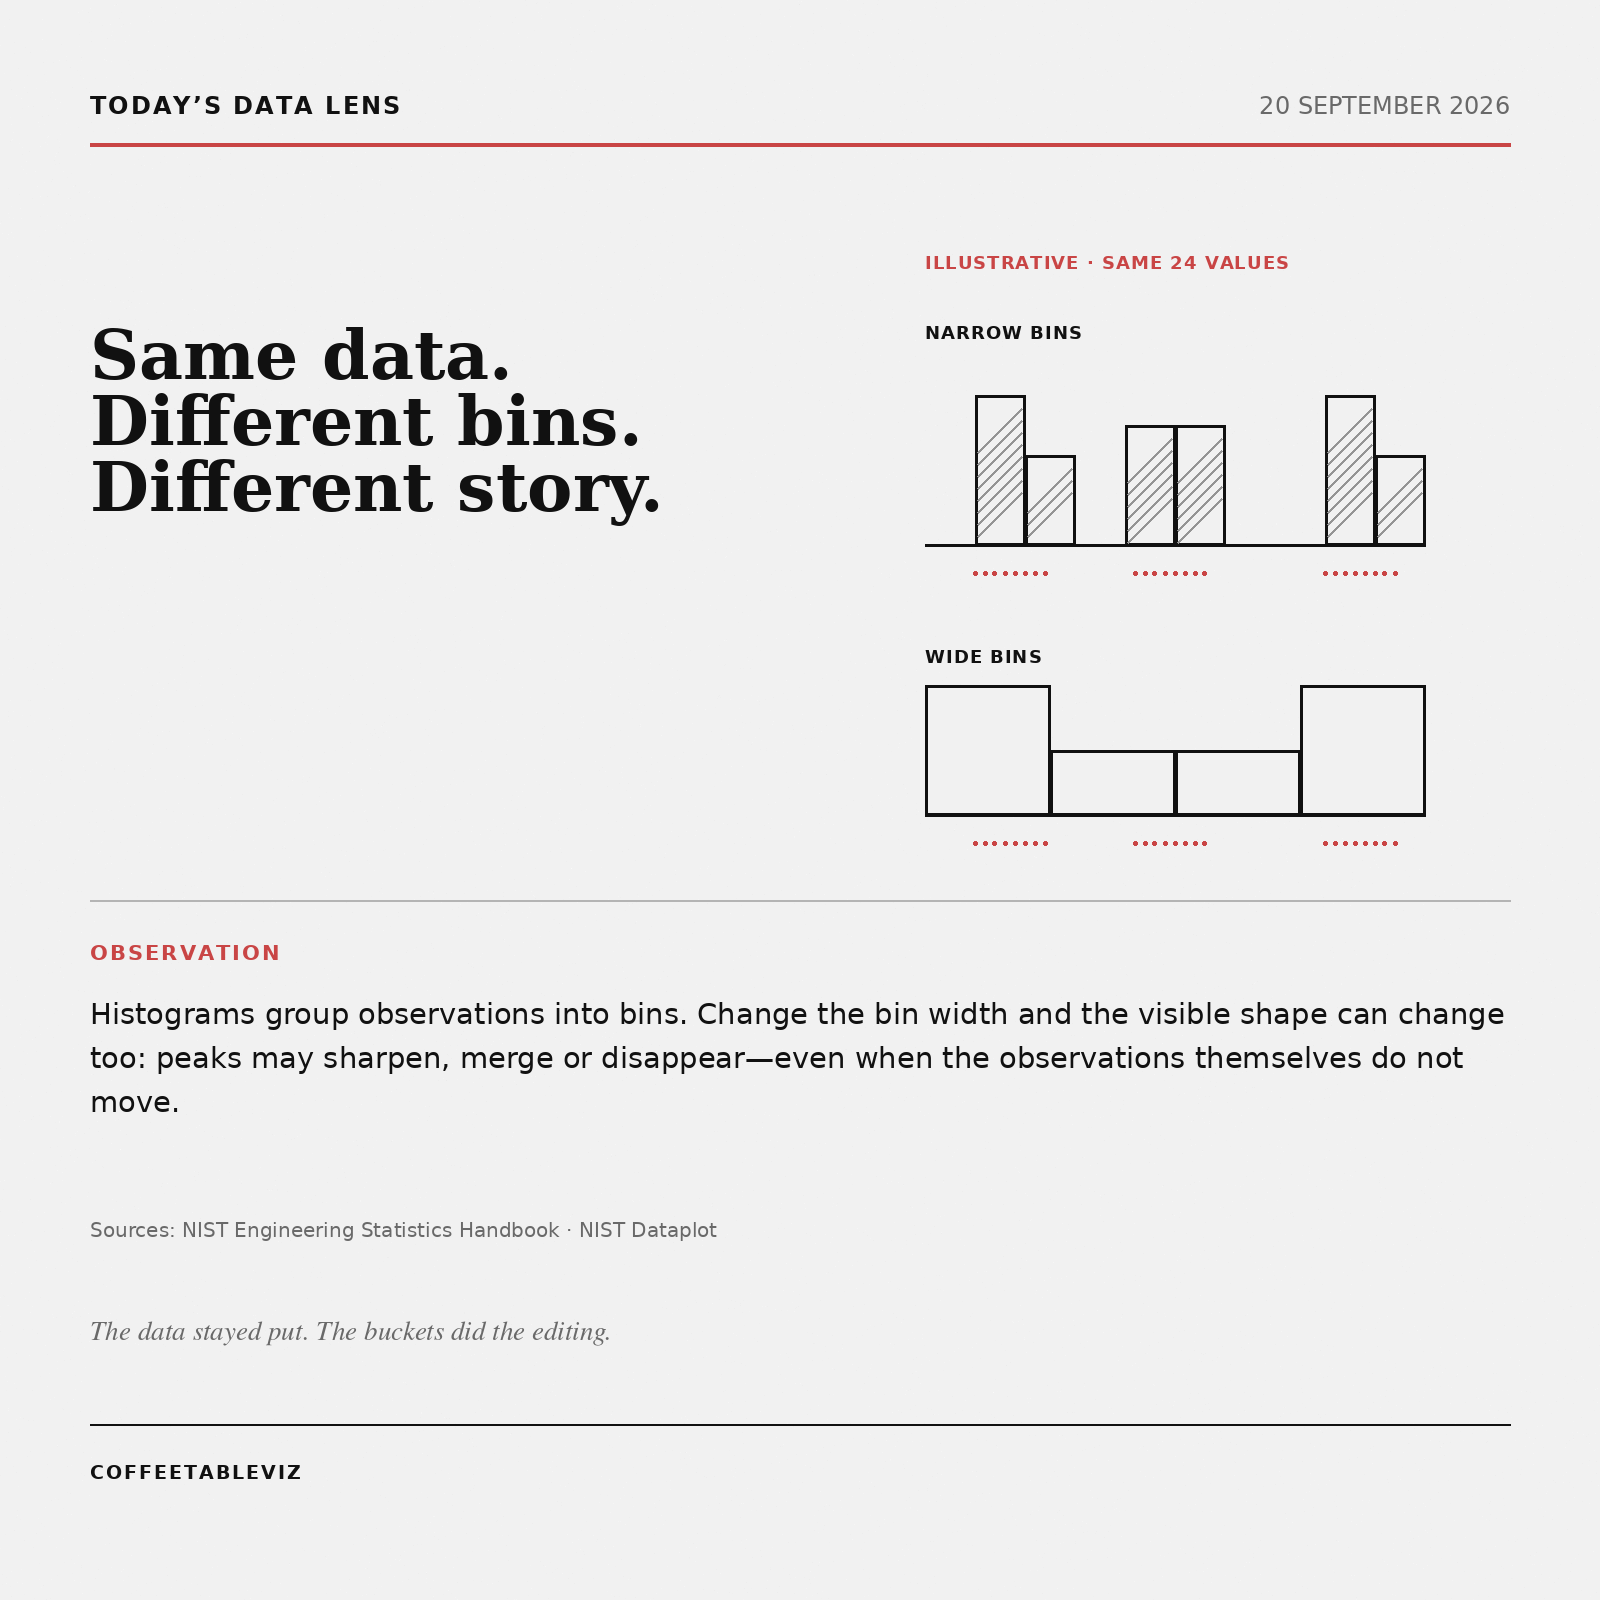
Same data. Different bins. Different story.
Observation
Histograms group observations into bins. Change the bin width and the visible shape can change too: peaks may sharpen, merge or disappear—even when the observations themselves do not move.
The data stayed put. The buckets did the editing.