TODAY’S DATA LENS
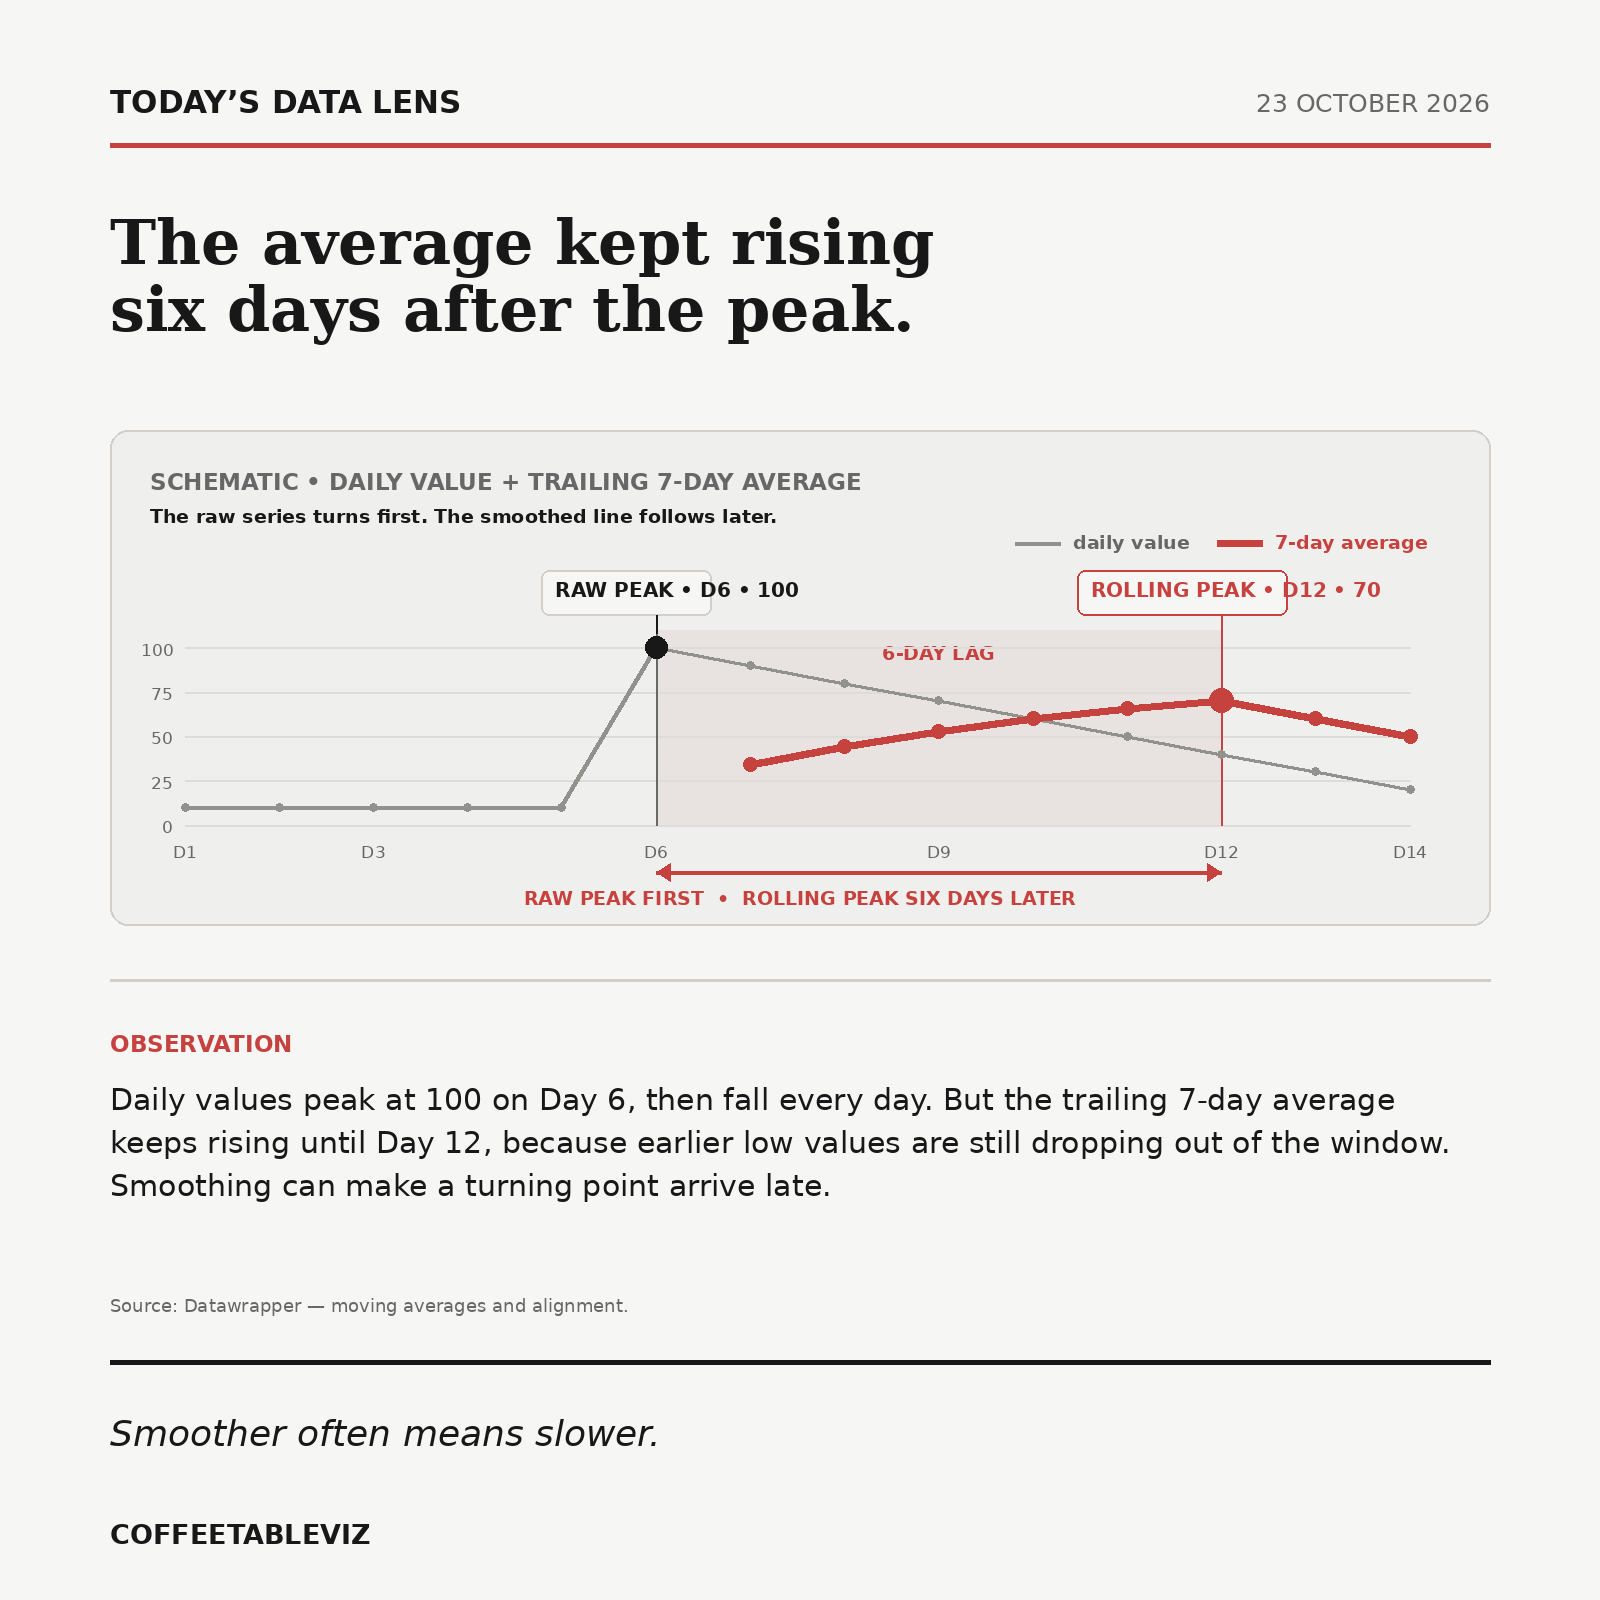
The average kept rising six days after the peak.
A little further
Rolling averages are useful when daily data is noisy — website visits, service demand or operational volumes, for example — because they make the underlying direction easier to see. The trade-off is timing: a trailing average still contains earlier observations, so a sharp turn in the raw data may take several periods to appear clearly in the smoothed line.
That matters if you are using the chart to identify peaks, recoveries or the effect of an intervention. Show the raw values as context where possible, and always state the rolling window being used.
Smoother often means slower.