Resource · A growing collection
Icons of Data.
The remarkable ways we turn information into understanding.
Not just charts. Maps, symbols, codes and even patterns you read with your fingertips. What do they have in common? Someone made a rather clever decision about how to represent information.
Start here
01 / Minard · 1869Icons of Data · 01
A line that disappears
In 1869 Charles Joseph Minard made the route of Napoleon's Russian campaign shrink as the army got smaller. One line, several jobs, and a rather uncomfortable history lesson.
Read the story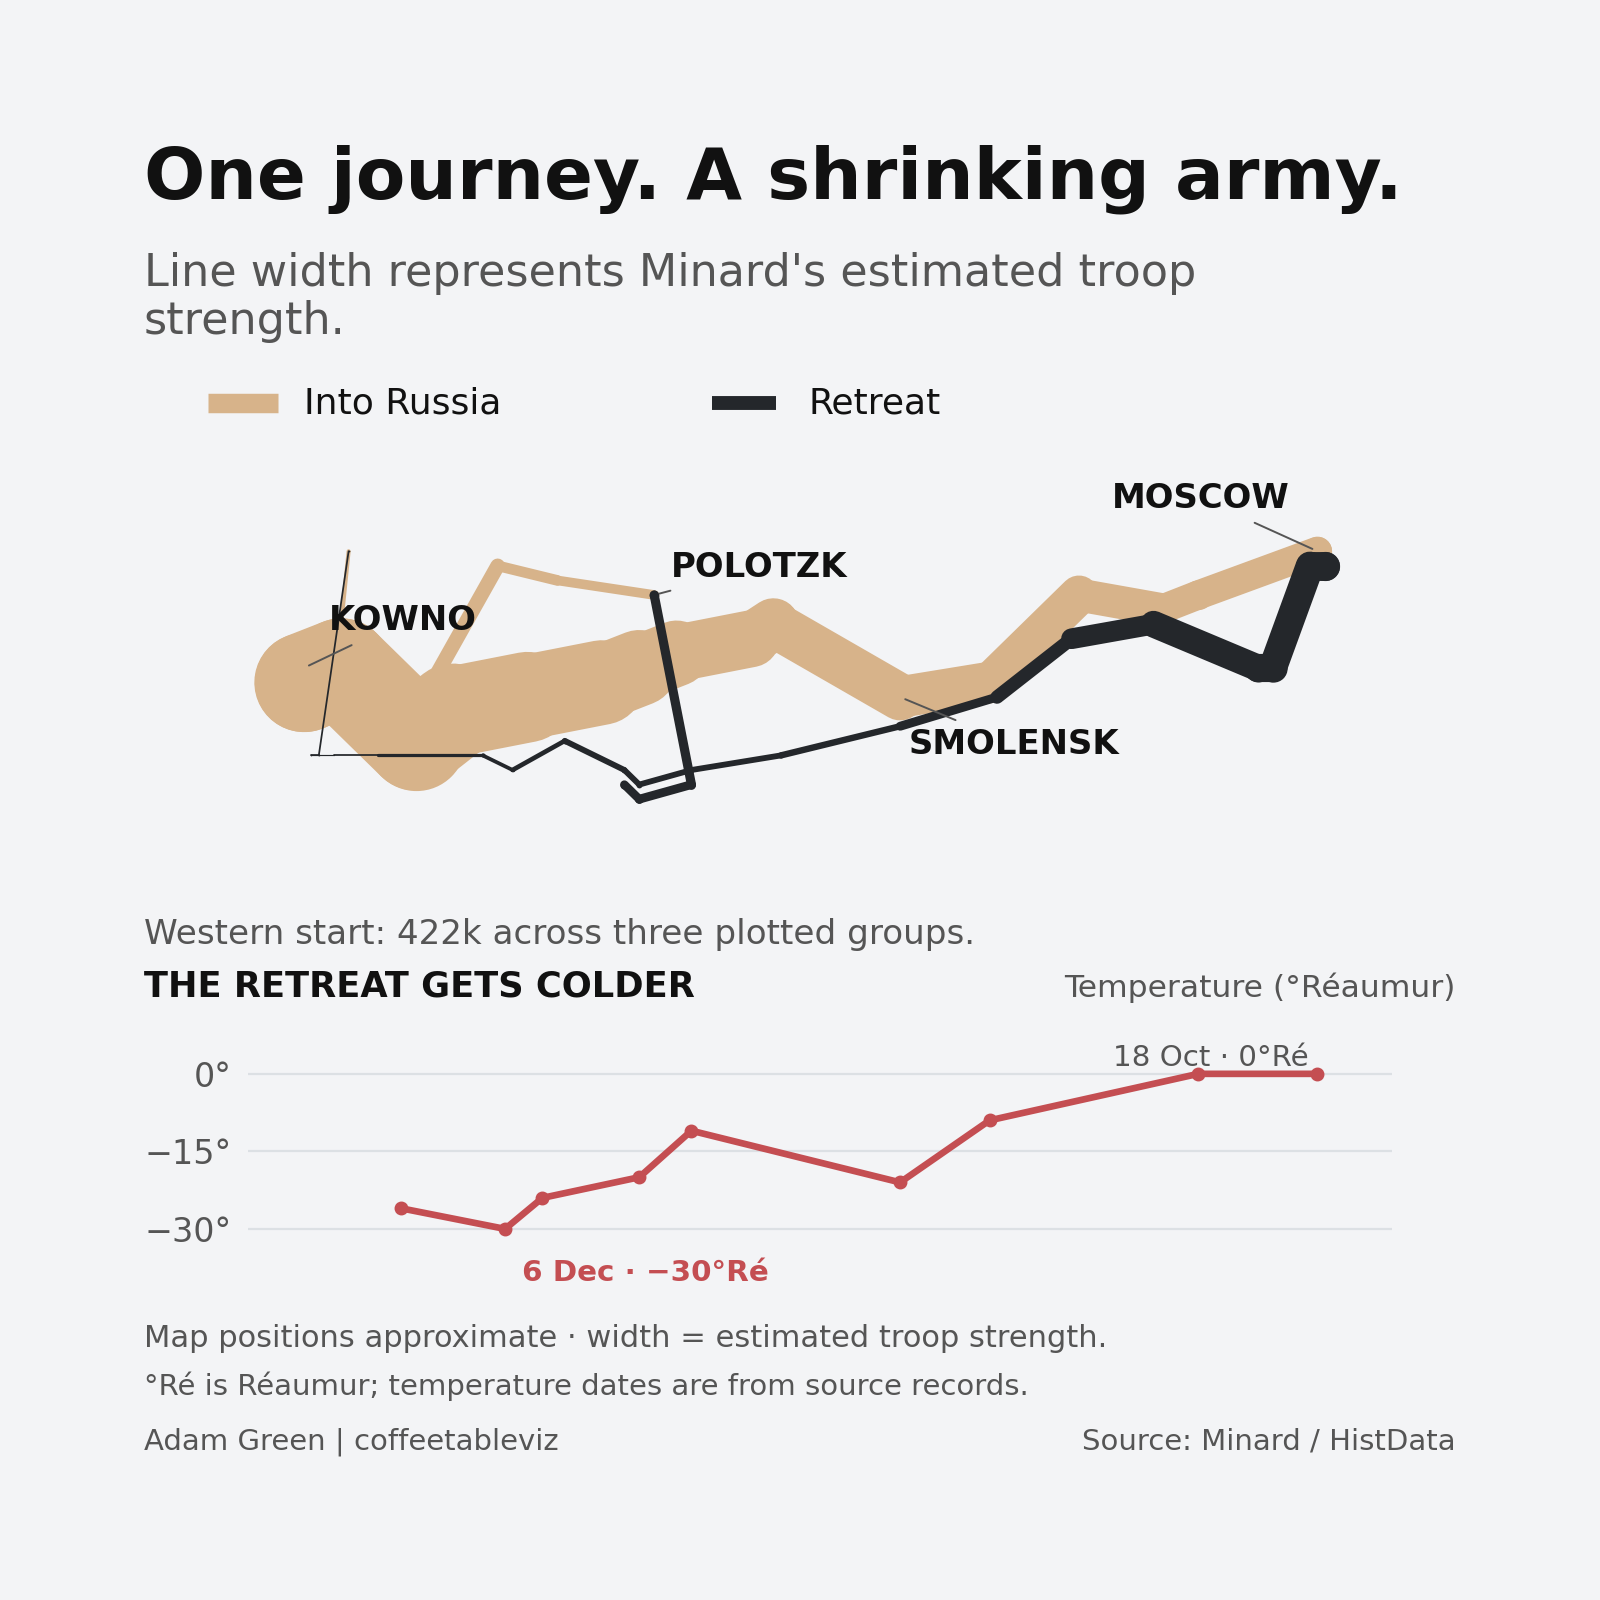
Our reconstruction uses Minard's plotted estimates. You can also explore his original 1869 map, including its French labels and temperature trace.

The clever bit
How information becomes a markA chart isn't clever just because it looks different. The interesting part is what each shape, line or colour tells us. Minard is a good place to start.
Where?
Place the line on a map and you can follow the army's route.
How many?
Make the line thinner as the estimated number of men falls.
Which way?
Pale marks show the advance. Dark marks show the retreat.
What else?
Add places, dates and temperatures to show more of the journey.
The full Decode the Icon visual pulls these four choices apart.
The collection
Seven stories · More to comeWe'll add new icons as they're researched and ready. The subject isn't limited to graphs — useful information has plenty of other shapes.
Charles Joseph Minard
The line that changed how an army's retreat could be understood.
Harry Beck's Tube diagram
When the connections between stations matter more than their exact positions. From a geographical map to a diagram you can follow.
Louis Braille's six-dot system
A writing system made to be felt. How six dot positions opened up independent reading and writing.
Florence Nightingale's mortality diagram
Blue areas carried a difficult argument about disease in the Crimean War. A persuasive graphic, and a reminder of what comparison cannot prove.
W. E. B. Du Bois's red spiral
A striking coil puts a huge 1890 rural population in the foreground. Data as an argument, with more to discover when we unwind it.
John Snow's Broad Street cholera map
Black marks clustered around a Soho water pump. Geography made a hypothesis visible, without proving it on its own.
Ed Hawkins' Warming Stripes
One year, one coloured band. A warming world becomes unmistakable without an axis — although the reference period still matters.
Encoding fingerprints
Different marks · Different jobsA quick look at the ingredients each icon uses. The marks describe the encoding, not a rating of how 'good' a design is.
| Icon | Position | Width | Colour | Connections | Touch |
|---|---|---|---|---|---|
| Minard | Yes | Yes | Yes | — | — |
| Beck | Yes | — | Yes | Yes | — |
| Braille | Yes | — | — | — | Yes |
| Nightingale | Yes | — | Yes | — | — |
| Du Bois | Yes | — | Yes | — | — |
| Snow | Yes | — | — | — | — |
| Hawkins | Yes | — | Yes | — | — |
Position means something slightly different on a map, a diagram and inside a tactile Braille cell. That's part of the point.
Sources & further reading
Keep the receiptsEvery edition will link back to its original sources, the decisions behind the design and any data used in our reconstructions.
View source notes
- Charles Joseph Minard's original 1869 map (public-domain reproduction), and the HistData reconstruction tables.
- London Transport Museum on Harry Beck's Underground diagram.
- Perkins School for the Blind on the history of Braille.
- Florence Nightingale's 1858 mortality diagram (Wellcome L0041105, CC BY 4.0) and the 24-month HistData transcription.
- W. E. B. Du Bois's City and Rural Population. 1890 (Library of Congress, c. 1900, no known restrictions on publication); source totals checked with Yale National Initiative and the US Census.
- John Snow's 1855 Broad Street cholera map (Wellcome Collection L0063431, CC BY 4.0); source coordinates and pump marks verified against the HistData Snow transcription.
- Ed Hawkins' original Global 2020 Warming Stripes (University of Reading Art Collection UAC/11018, shared under Creative Commons terms); Hawkins on the 2023 baseline change; and the Met Office HadCRUT5 annual data used for the separate 1850–2025 reconstructions.

