Icons of Data
The map that put connections first
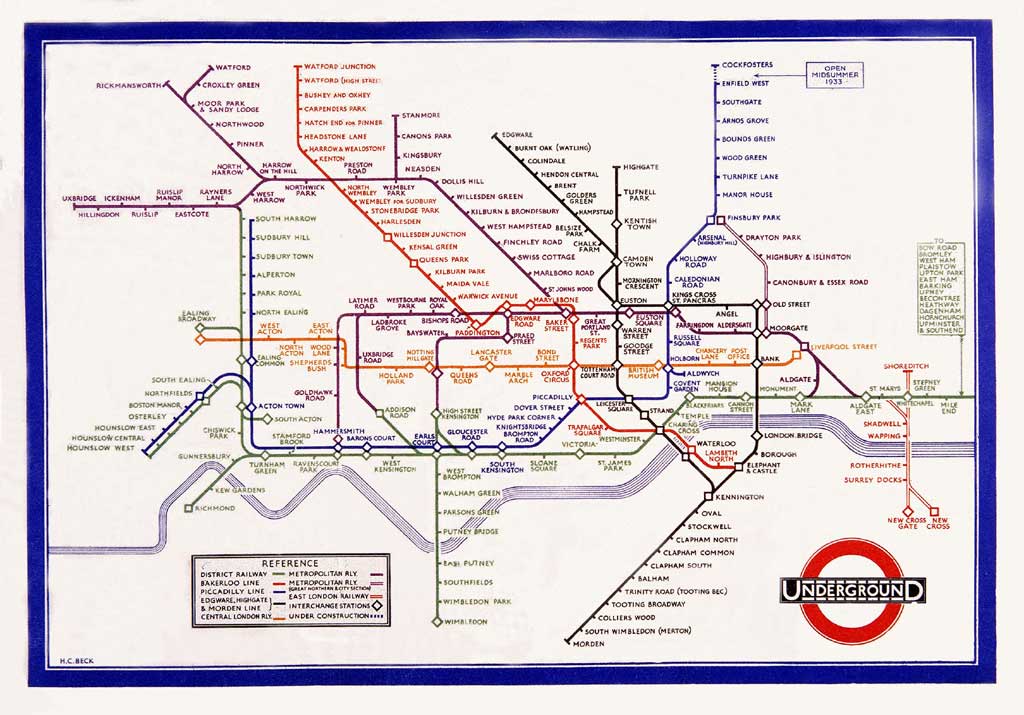
Harry Beck's Underground diagram rearranged the geography so passengers could follow the connections. A neat lesson in what a map chooses to show.
London’s Tube map is very good at helping you get across London.
It’s rather less concerned with showing you exactly where London is.
And that’s the clever bit.
In 1931, Harry Beck, an Underground engineering draughtsman, started rethinking the network map. The result reached passengers in 1933.
His big idea was to stop treating the Tube like a geography exam.
A map that’s not quite a map
Early Underground maps had a problem.
The network kept growing. Central London was crowded with stations, while the outer branches spread across an enormous area.
Keeping everything geographically faithful made it increasingly awkward to read.
Beck took a different approach.
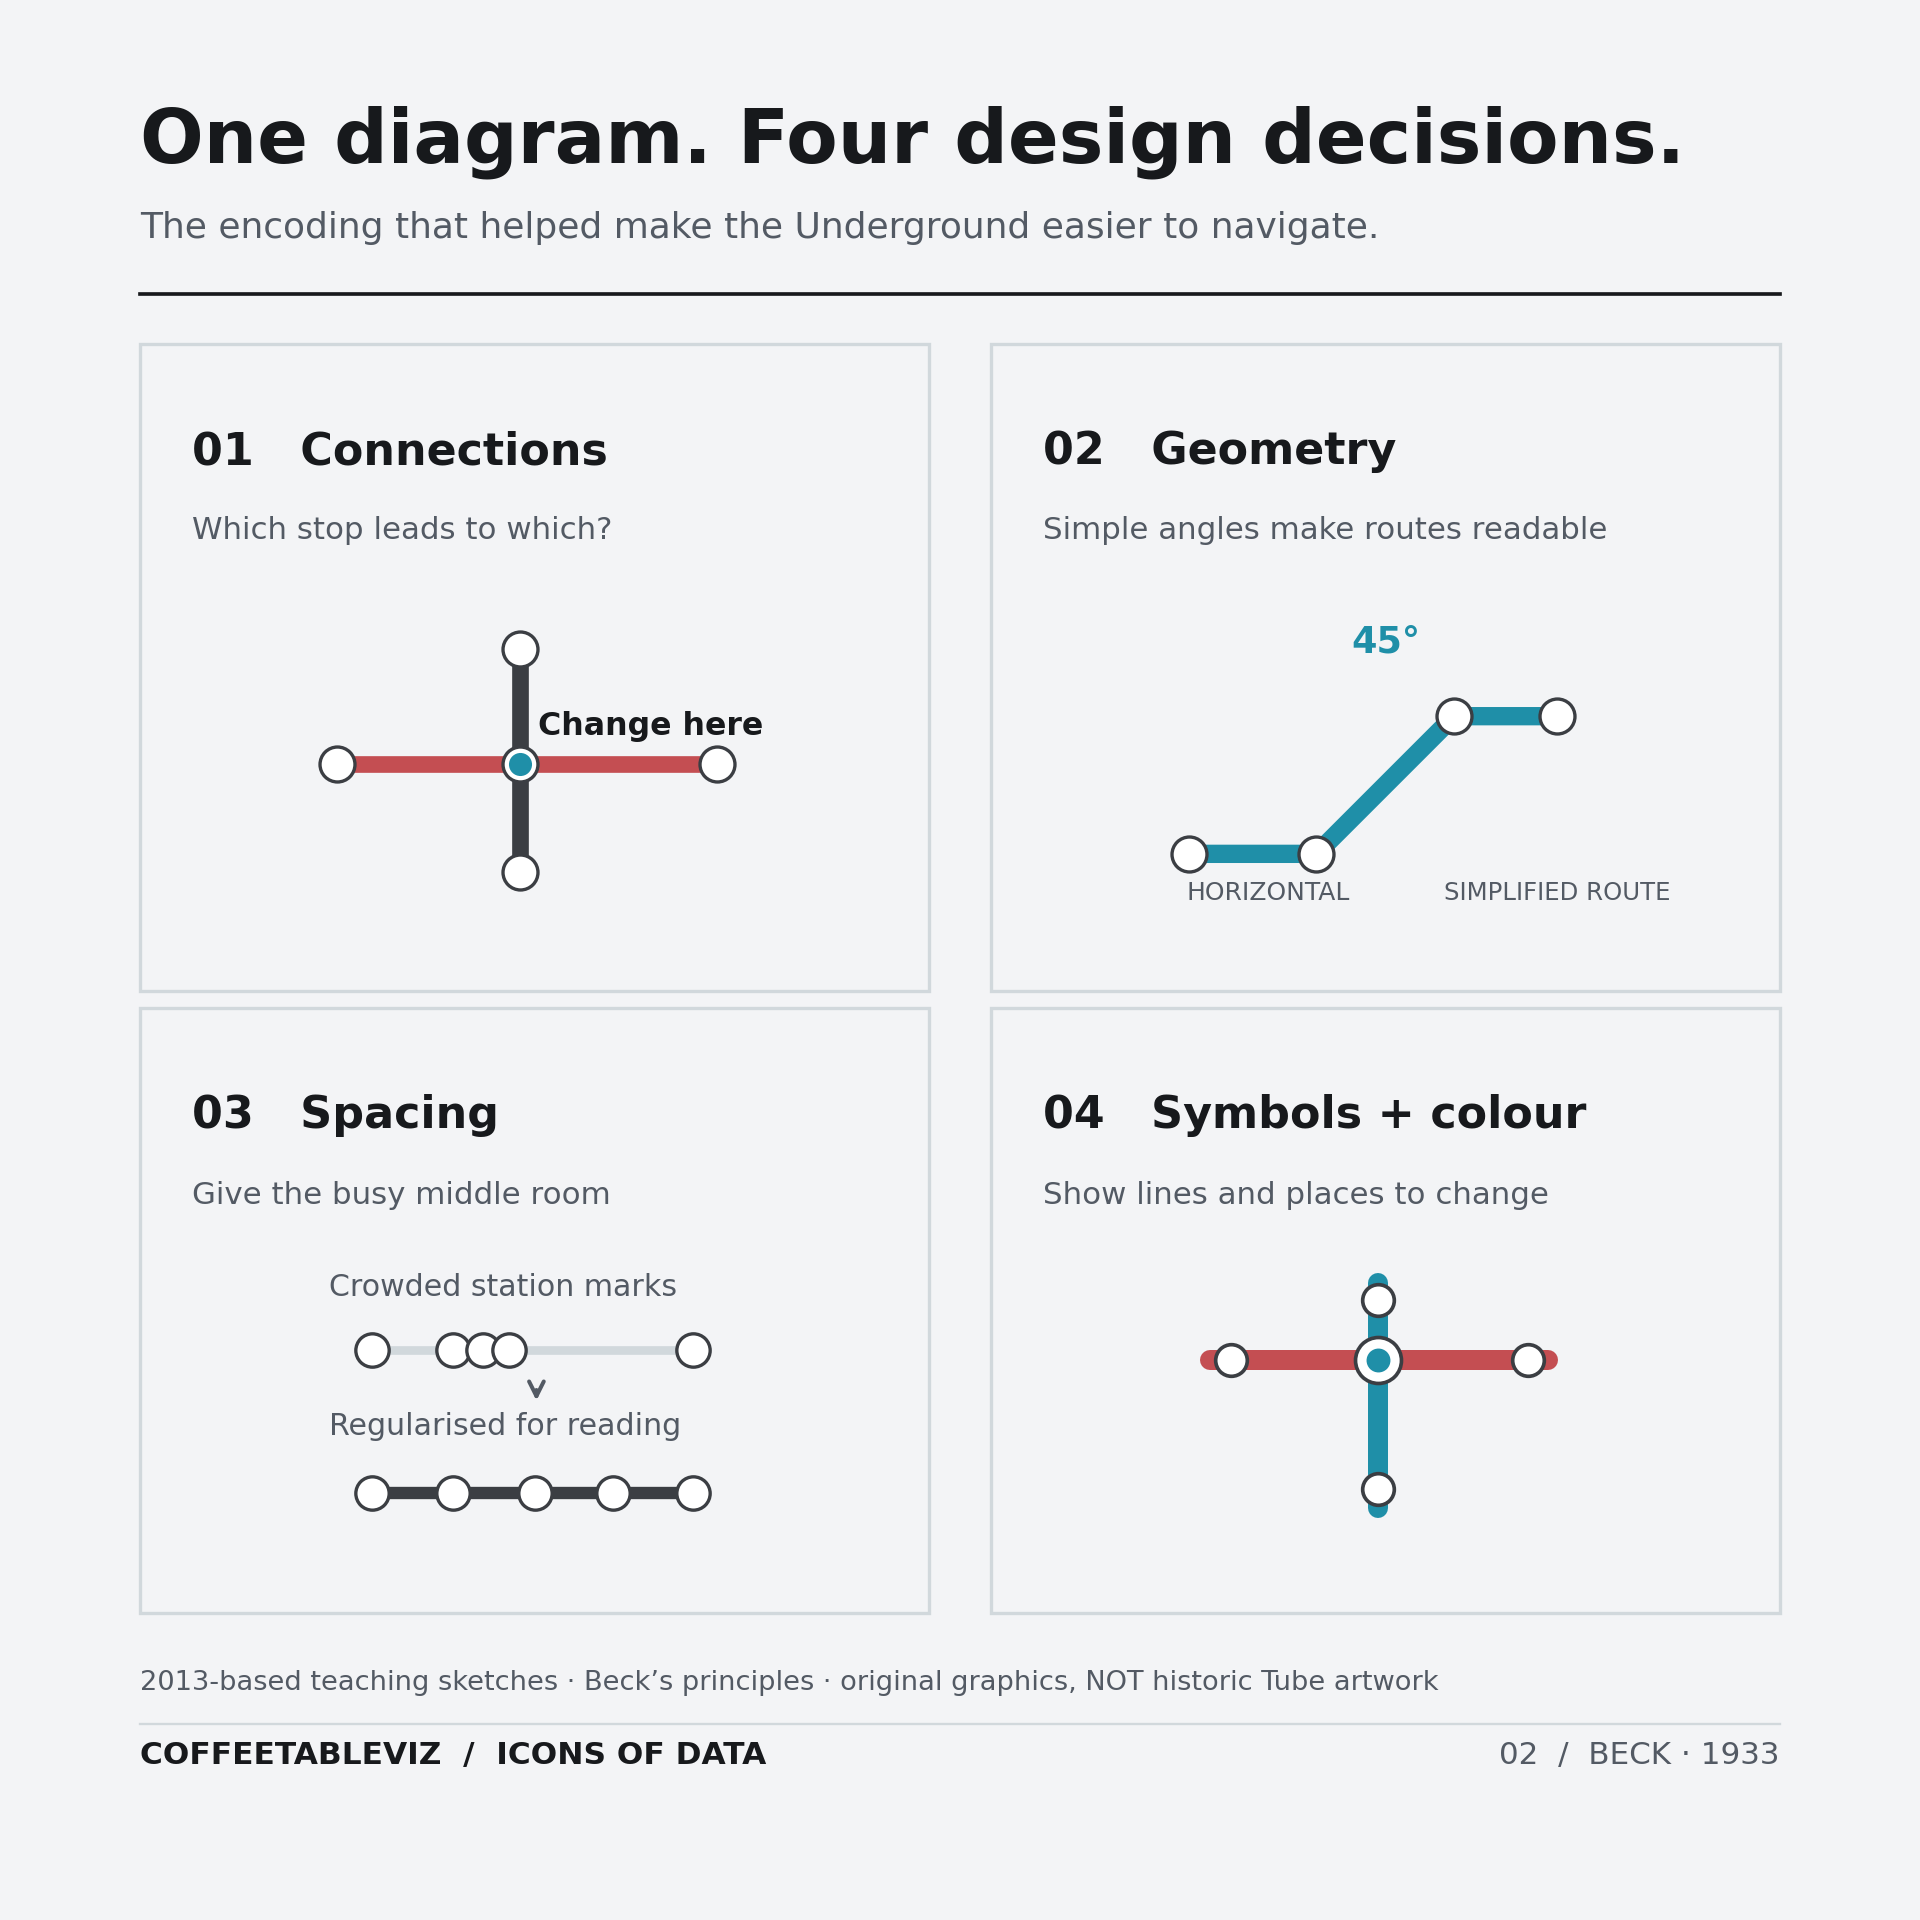
He straightened routes into horizontal, vertical and 45-degree lines. He gave crowded central stations more breathing room, spaced stops more regularly and made interchanges easier to spot.
The result wasn’t a conventional map at all.
It was a diagram of connections.

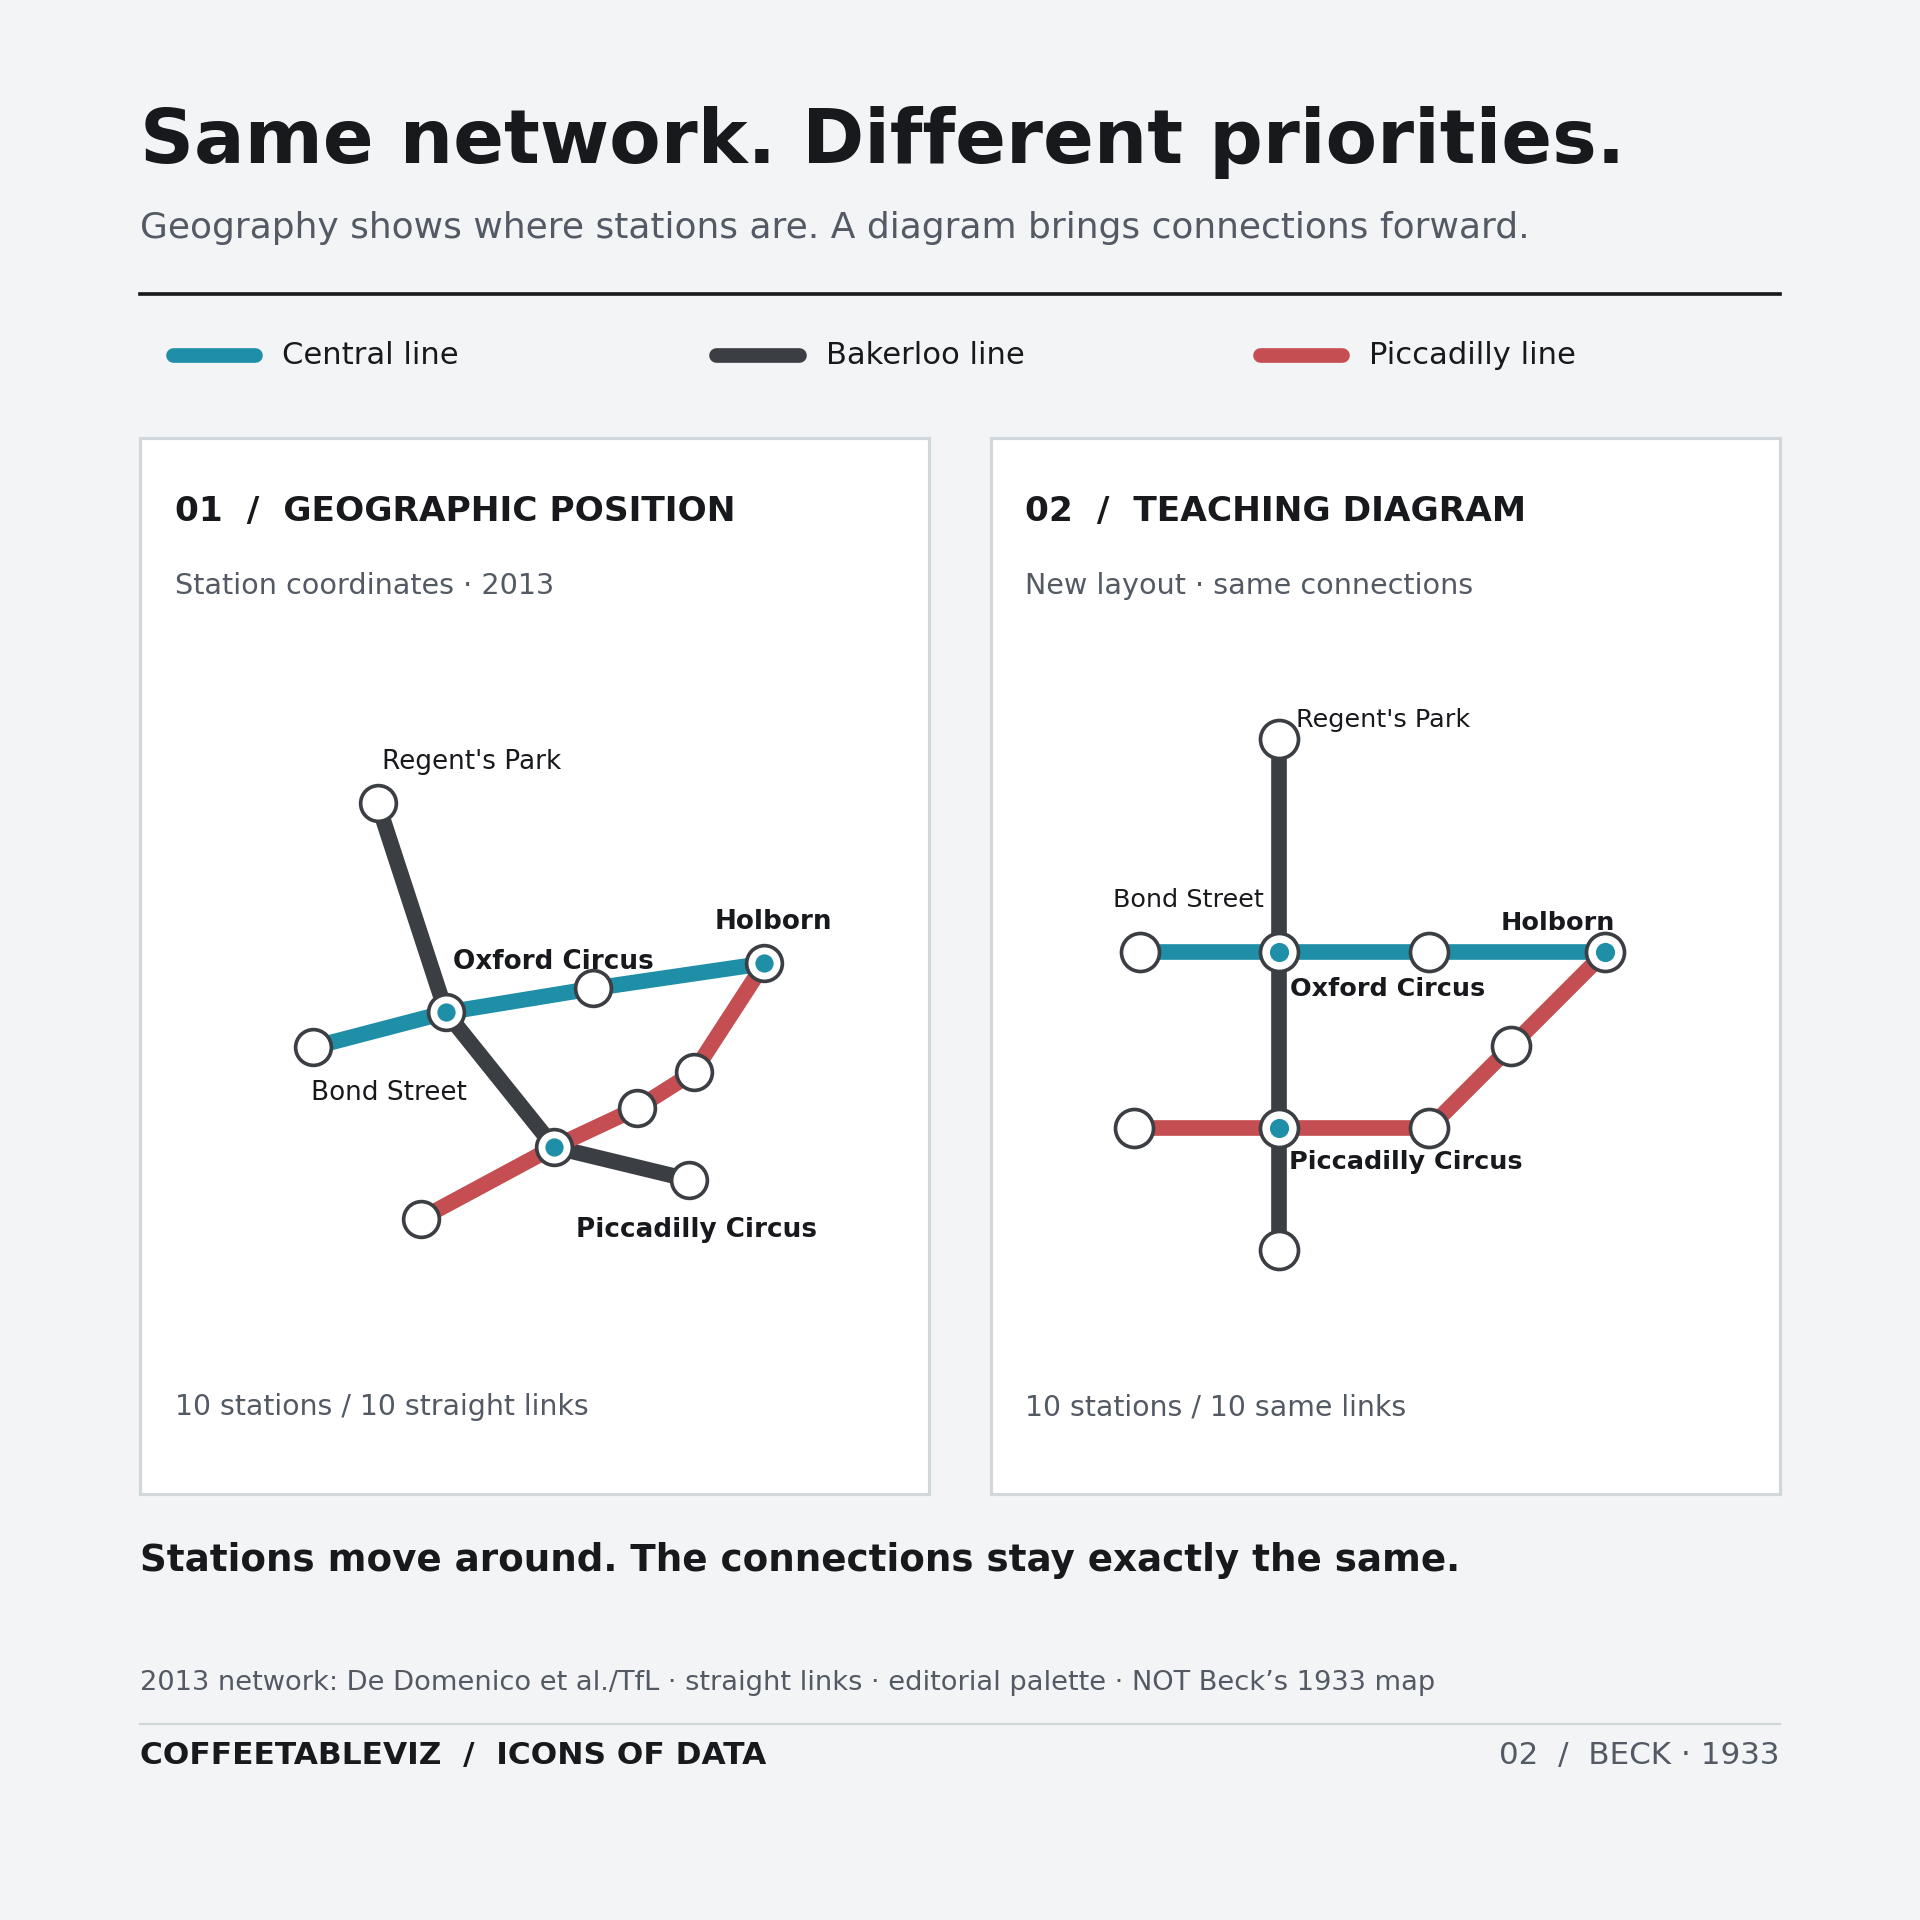
Geography can get in the way
Think about what you actually need when you’re on the platform.
Which line? Which direction? Where do you change?
Usually not the exact bend of the tunnel beneath the road.
Beck kept the relationships between stations while loosening their geographical positions.
That’s an important distinction. He didn’t invent colour-coded rail maps or the idea of simplifying a network. His achievement was bringing those choices together into something wonderfully readable.
It was also a bold change. The first proposal was rejected as too radical, before the design was trialled and then printed in 1933.
Which is a lovely reminder that even obvious ideas sometimes take a little explaining.
The useful kind of wrong
There’s a catch, of course.
The Tube diagram isn’t a reliable guide to distances above ground. Two stations that look far apart on the page might be close enough to walk between.
And a tidy network diagram won’t tell you how long your journey will take.
Those aren’t necessarily design failures. They’re the result of choosing one question to answer particularly well.
TLDR
Harry Beck made London’s Underground easier to navigate by putting connections before geography.
It wasn’t a more accurate picture of where the stations were.
It was a more useful picture of how to get between them.
A diagram doesn’t have to tell you everything.
Just the right thing.
simple charts clear stories.