Icons of Data
A line that disappears
In 1869 Charles Joseph Minard turned Napoleon's disastrous Russian campaign into a line that shrank. The clever bit? Width became information.
Napoleon’s invasion of Russia in 1812 didn’t exactly go to plan.
An enormous army marched east towards Moscow. A considerably smaller one made it back.
Historians have spent rather a lot of time explaining what went wrong. Battles, disease, hunger, exhaustion and, of course, the Russian winter.
In 1869, French engineer Charles Joseph Minard decided to tell the story rather differently.
He drew a map.
And made the line shrink.
Not your usual route map
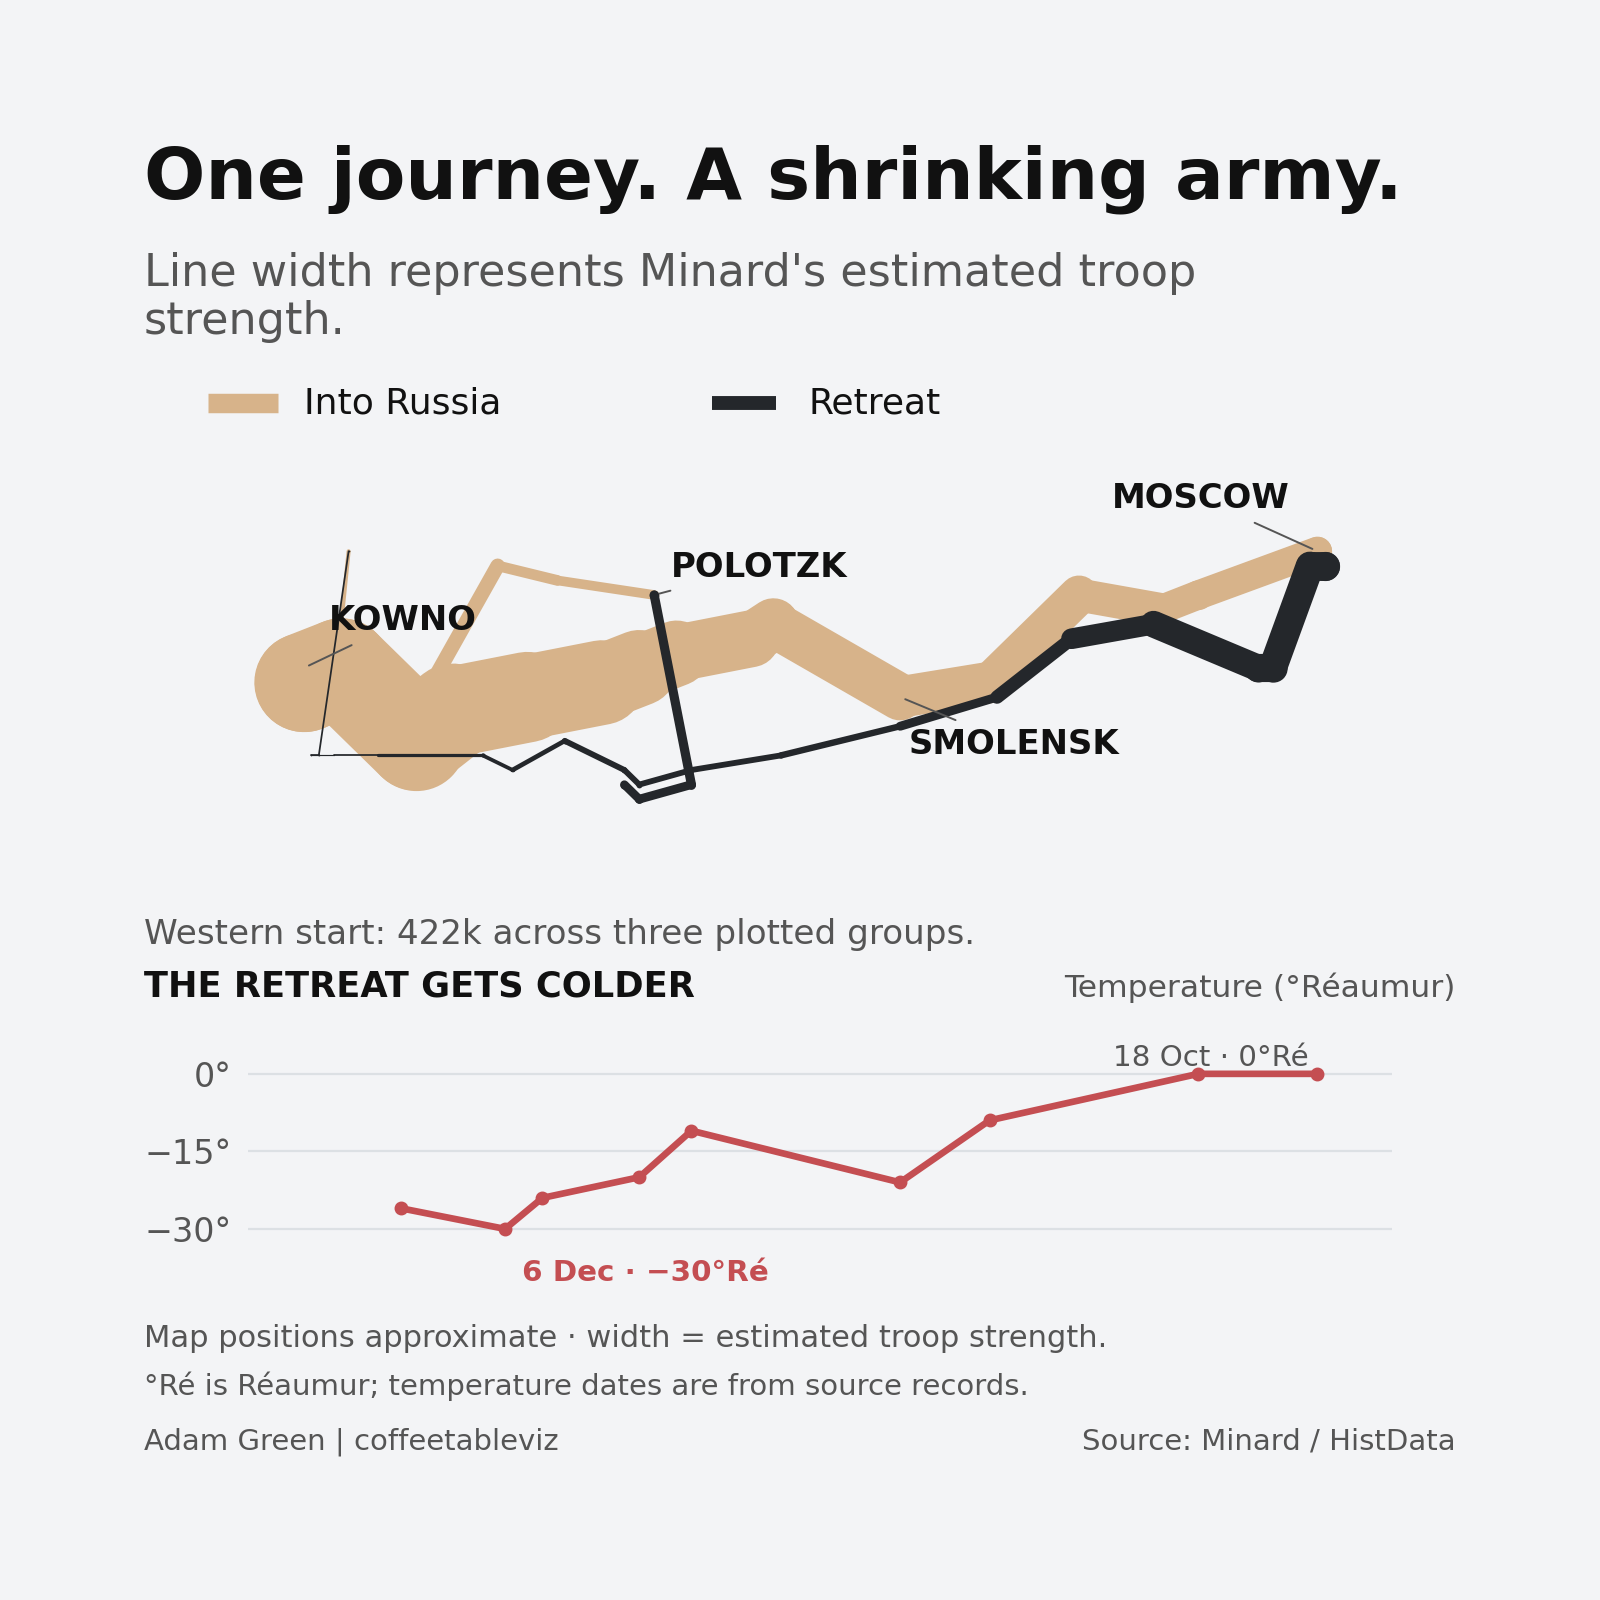
At first glance, Minard’s famous illustration looks like a map of Napoleon’s journey across Russia.
The pale band follows the army towards Moscow. The dark one traces the retreat.
But look a little closer.
The width of each band represents the estimated number of men in the army.
As the numbers fall, the line narrows. By the time it heads back west, there’s precious little width left.
You don’t need to know much about military history to appreciate that things have gone rather badly.

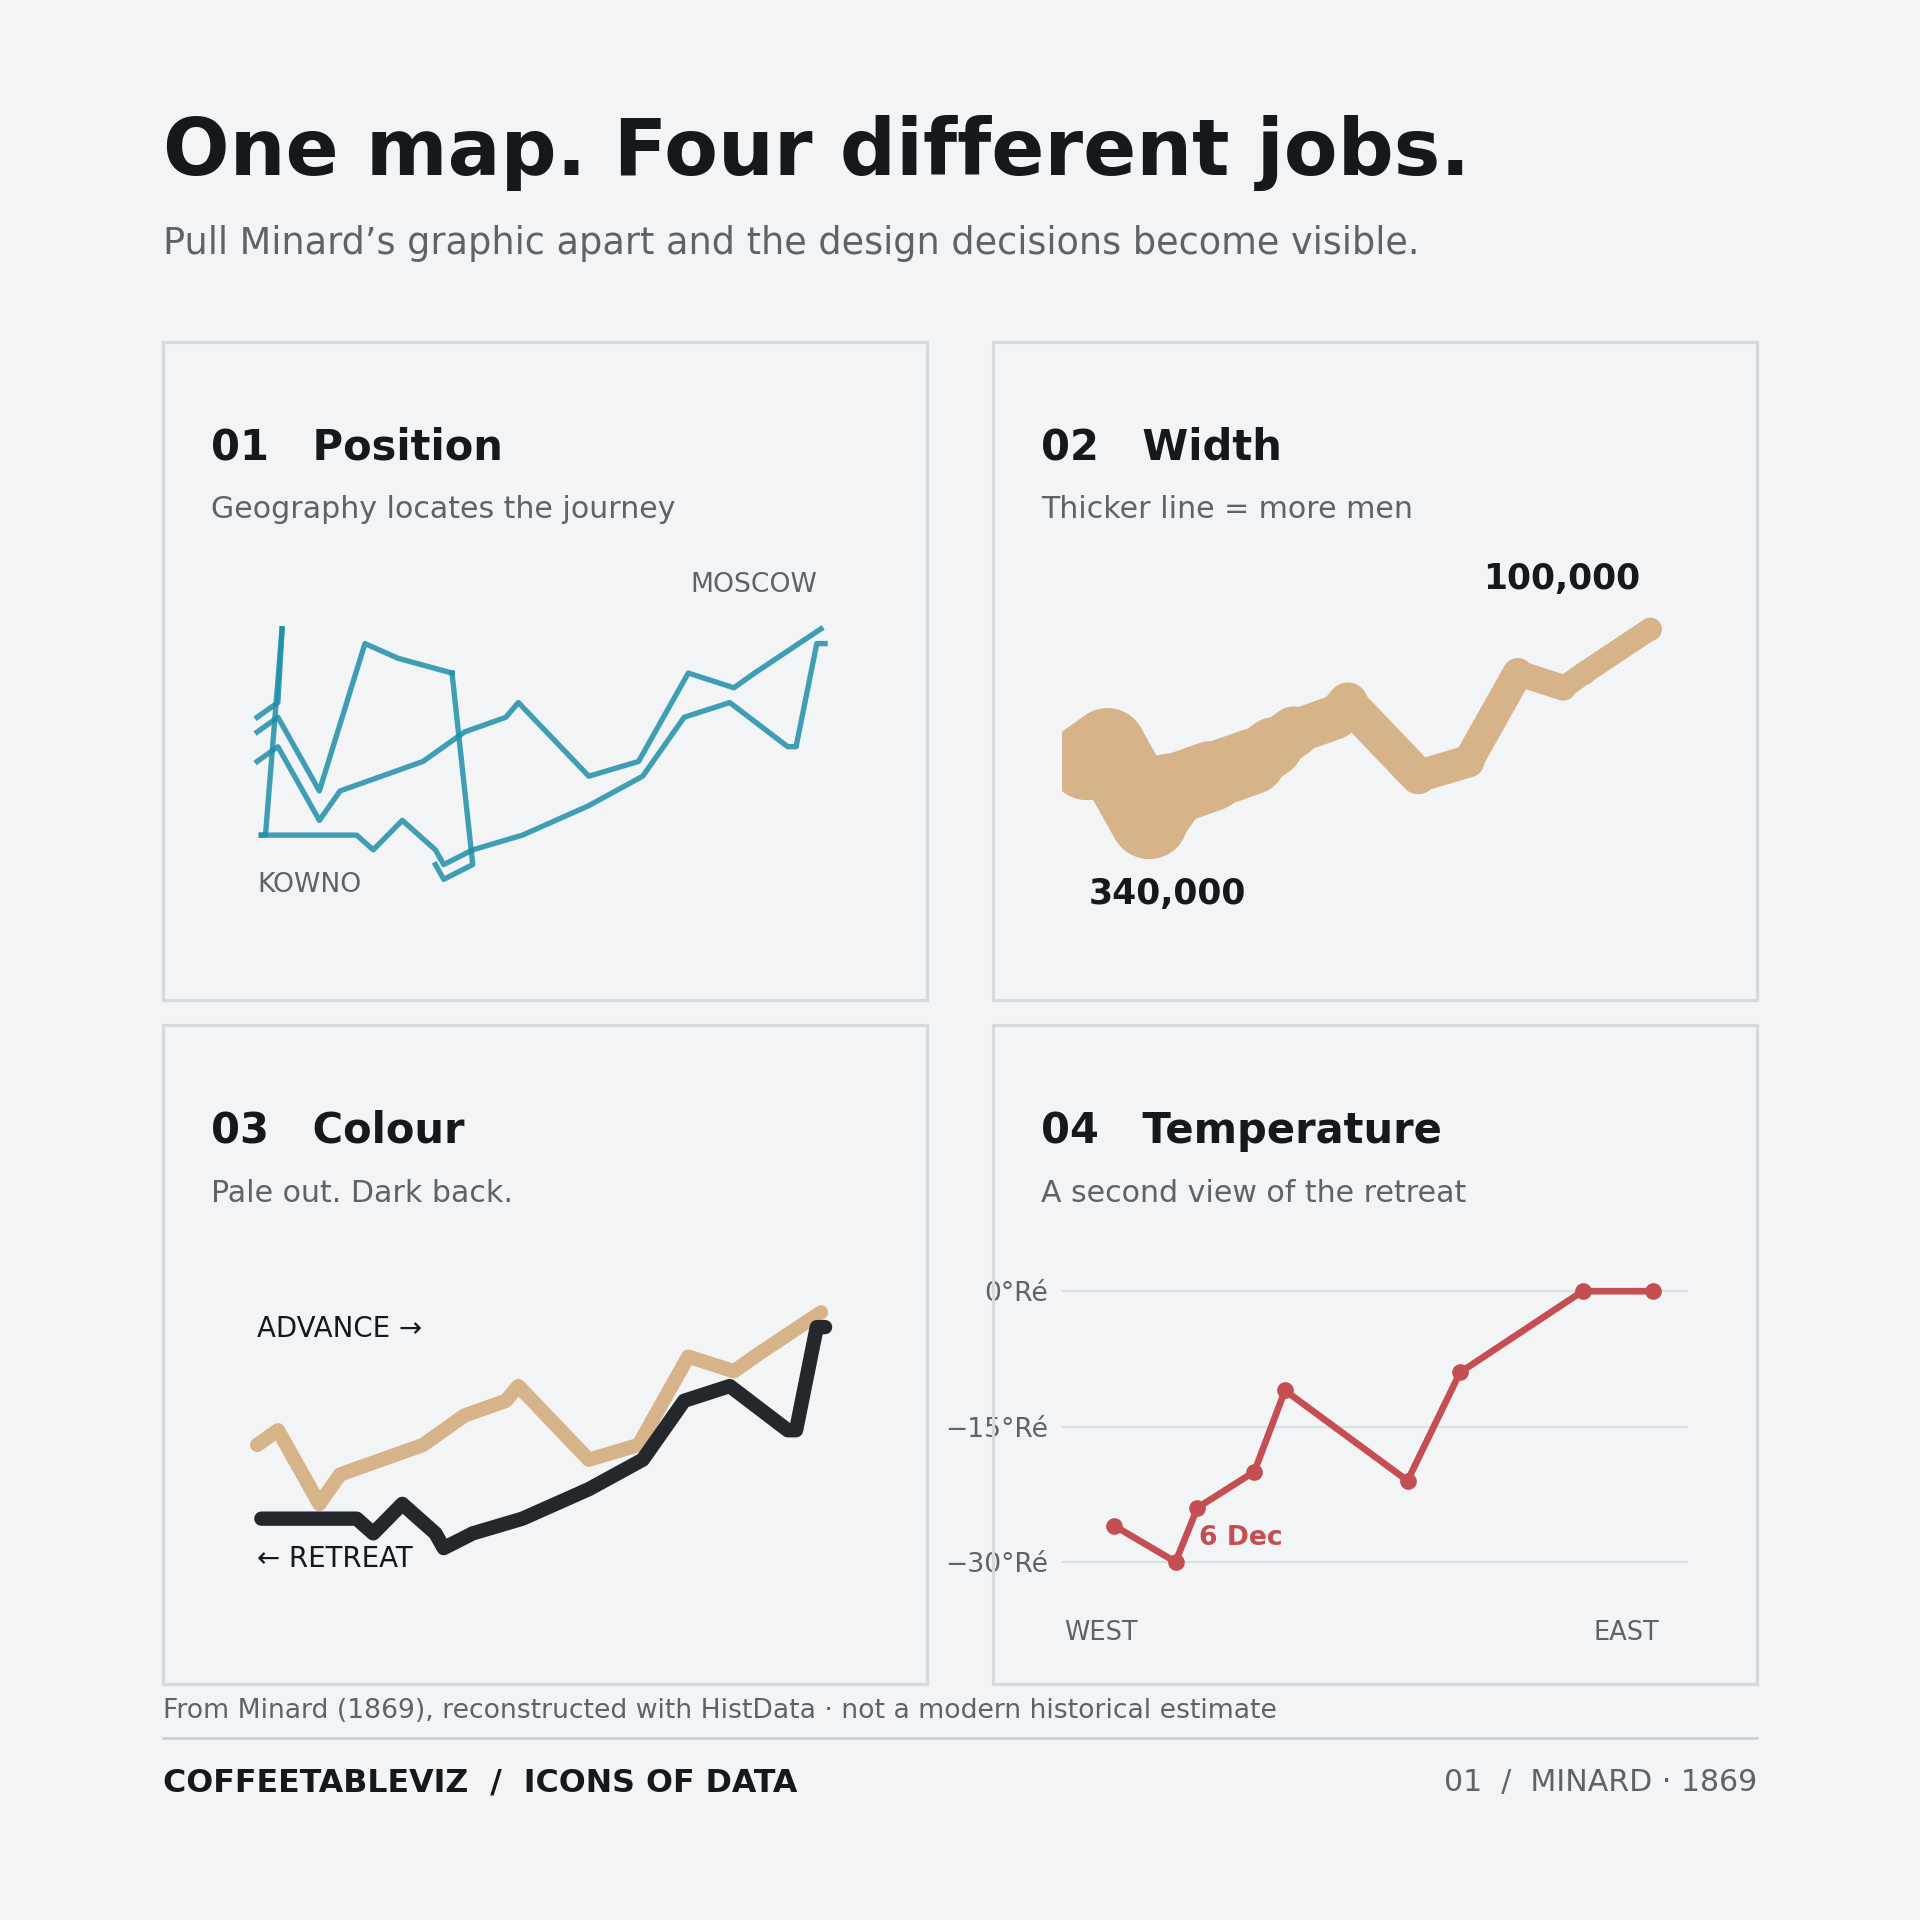
One line. Several jobs.
What makes this remarkable isn’t simply the shrinking line.
Minard manages to combine geography, troop numbers, direction, place names and dates. Beneath the map, he even plots temperatures recorded during the retreat.
And those temperatures make for fairly uncomfortable reading.
The clever part is how naturally the different pieces fit together.
The route tells us where the army travelled. The width tells us how many men remained in Minard’s estimates. The temperature chart adds another layer of context to an already disastrous journey.
Each element tells us something different, but together they tell one story.
All on a single sheet of paper.
In 1869.
But there’s always a catch
As compelling as the illustration is, it isn’t a perfect historical record.
Minard worked with estimates and made deliberate simplifications about the movement of different army units.
The shrinking line doesn’t mean everyone who disappeared from the count died. Nor does the temperature chart prove that the cold caused every loss.
Those distinctions matter.
A brilliant visualisation can tell a powerful story without telling us absolutely everything.
TLDR
Most lines on maps tell us where something goes.
Minard made the width of his line tell us how much remained.
He combined several different ways of encoding information into one extraordinary illustration.
More than 150 years later, it’s still a rather good lesson in visual storytelling.
Sometimes the cleverest thing you can do with a line is make it thinner.
simple charts clear stories.