Icons of Data
The map that put a pump on trial
John Snow's 1855 map made a striking pattern of cholera deaths visible. Why the Broad Street pump mattered — and why the map alone could not settle the case.
The most suspicious object in a London neighbourhood in 1854 wasn’t a person.
It was a water pump.
And John Snow had a rather compelling map to go with his suspicions.
One death. One black mark.
In late August and September 1854, cholera spread through Soho, leaving many families devastated.
Snow was already investigating the idea that cholera could travel through contaminated drinking water. When people became ill around Broad Street, he examined their addresses, asked where they obtained water and looked for explanations that fitted the evidence.
His map, published in 1855, placed the fatal attacks he could trace on a street plan. Short black bars stood at affected houses. Several bars at an address meant several deaths.
He also marked the neighbourhood’s public water pumps.
And the concentration of black marks around the Broad Street pump was difficult to ignore.

Location is doing the talking
On a table, an address is just another row.
On a map, it has neighbours.
The short bars show where fatal attacks were recorded. The pumps introduce a possible explanation for the pattern. The streets matter because the nearest pump in a straight line wasn’t necessarily the easiest to reach on foot.
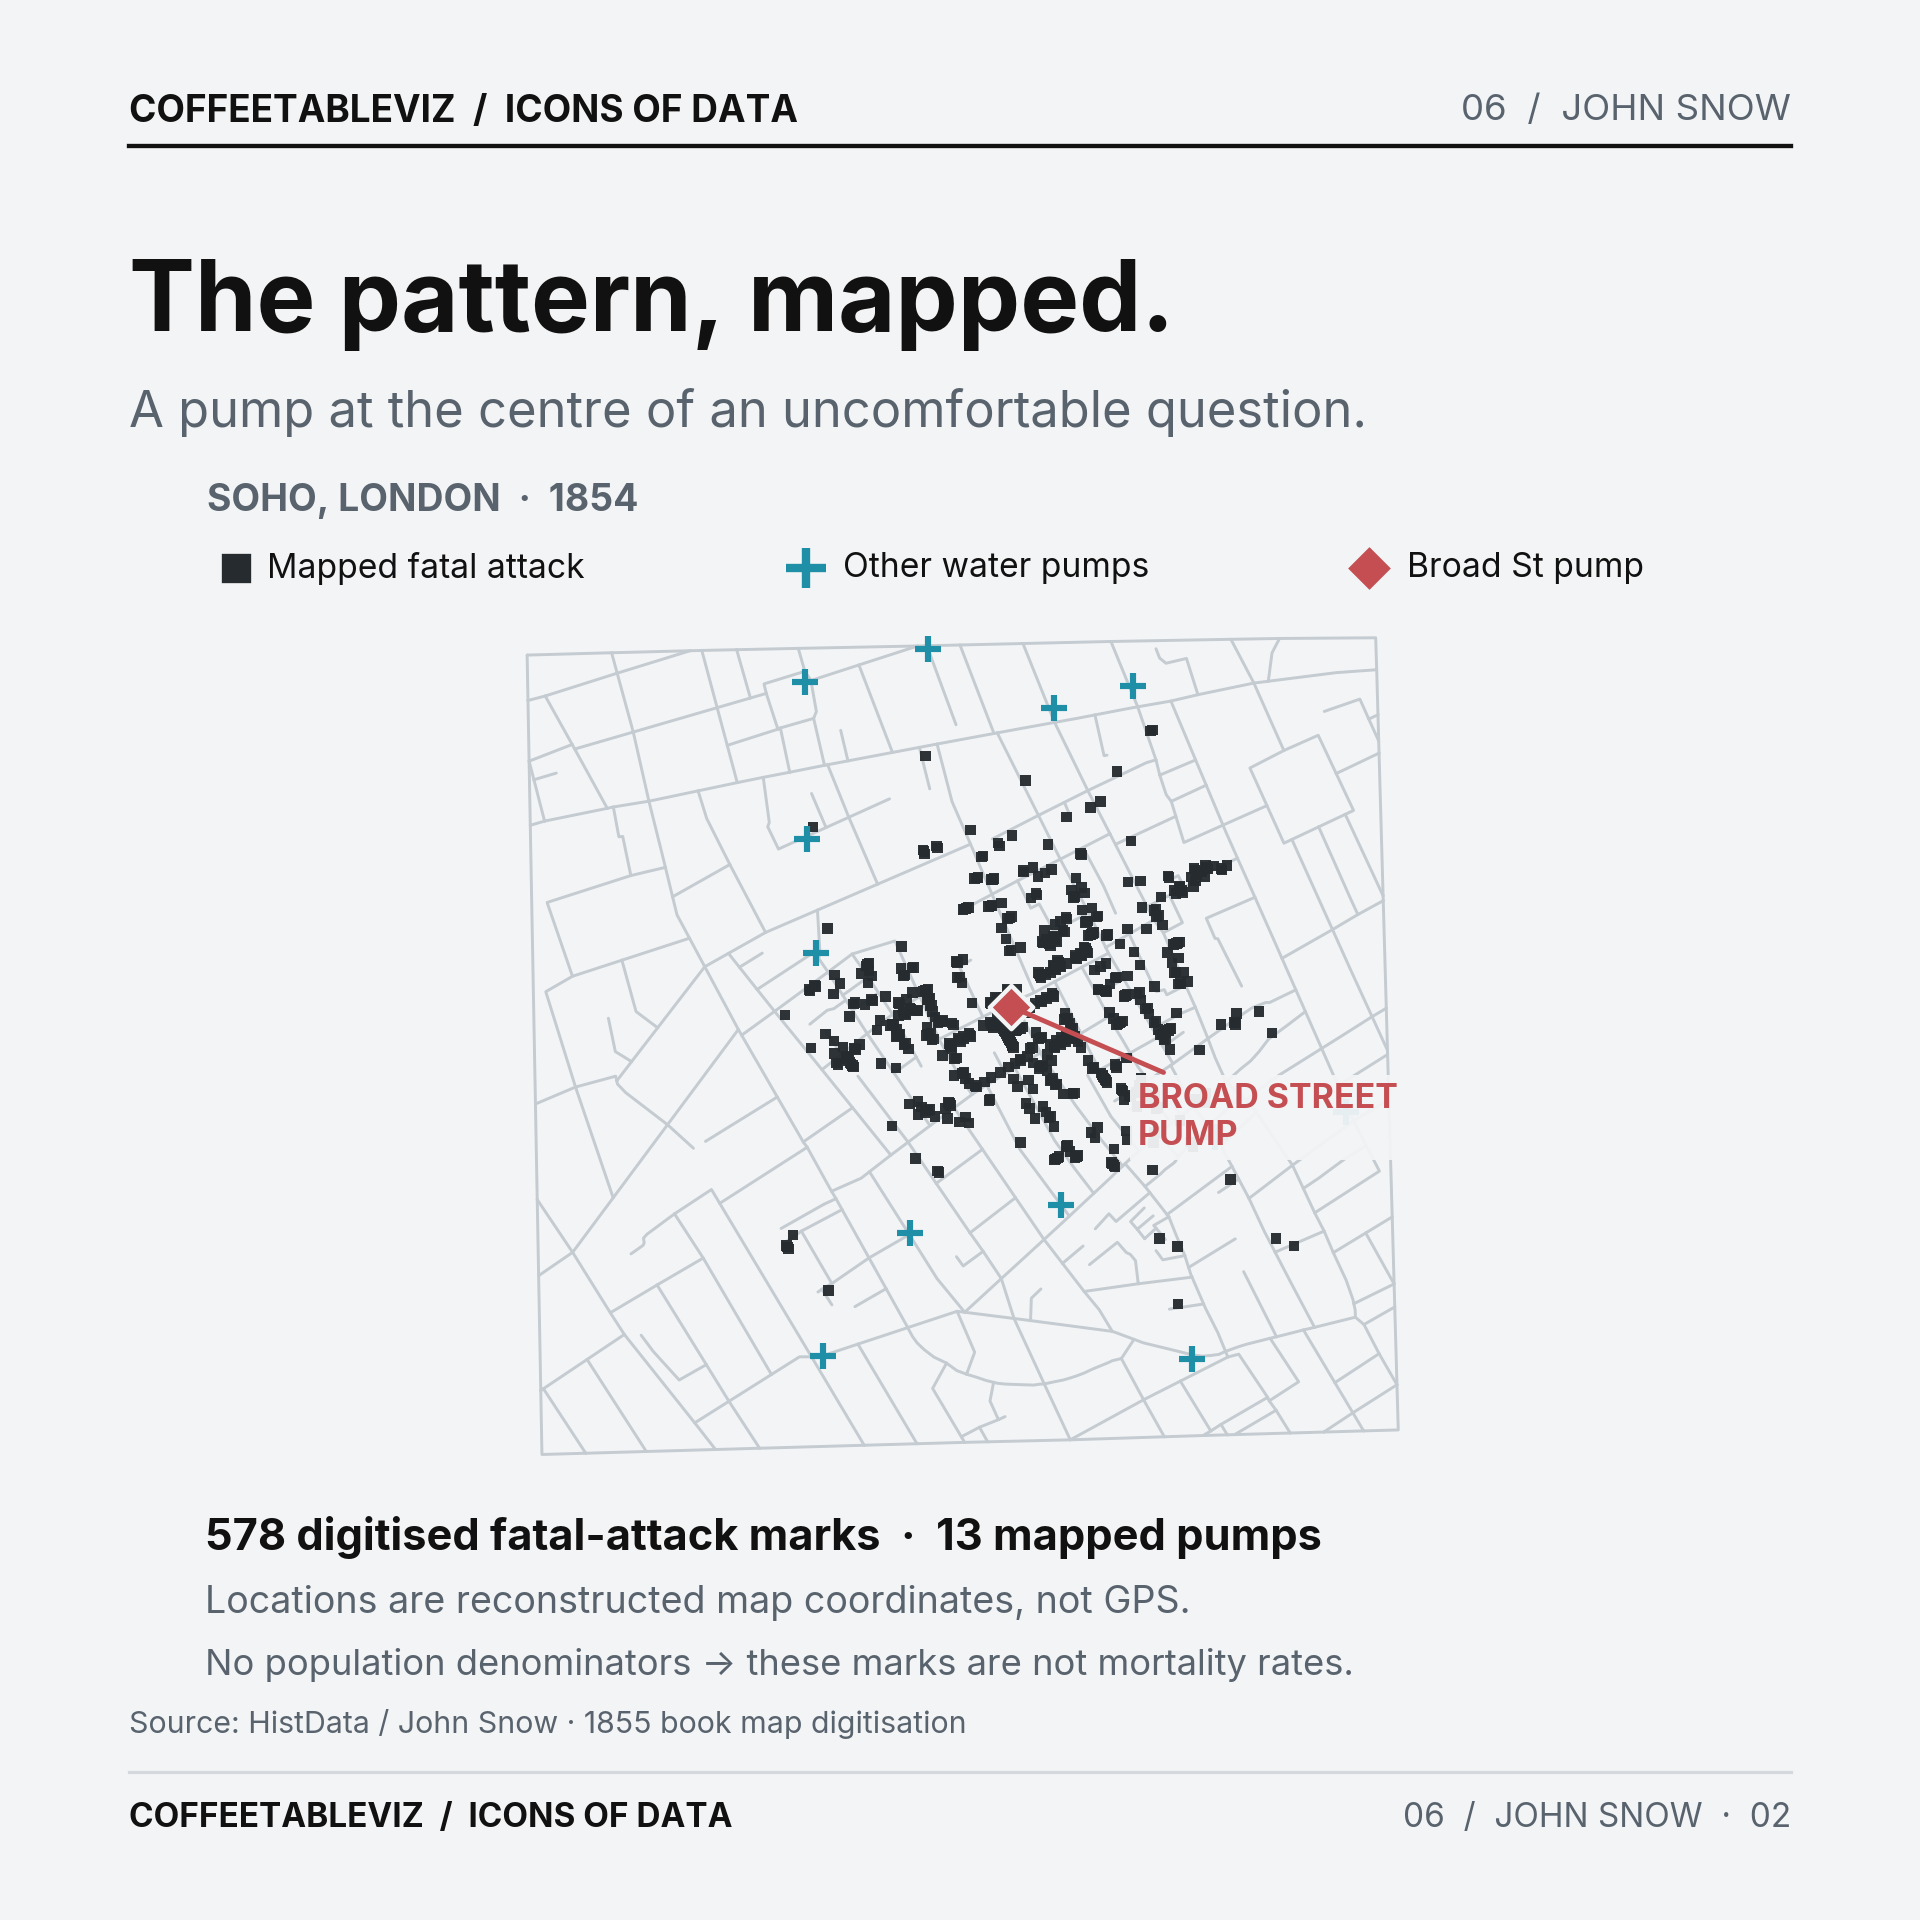
HistData digitisation: 578 mapped fatal-attack marks, 13 water pump locations and 528 street polylines. These are source map-drawing coordinates, not GPS locations. Squares replace Snow's original bars and modern colours highlight pump positions; the Broad Street pump is a red annotation added by us. The 578 rows are not an estimate of the outbreak's complete death toll, nor are they mortality rates.It’s a beautifully economical encoding. A reader can see the neighbourhood pattern almost immediately, where a list of addresses might take far longer to explain.
But a convincing cluster is not the same as an answer.
What isn’t on the map?
The black marks don’t tell us how many people lived at each address. They don’t show everyone who became ill, where water was actually consumed or when each exposure happened.
The map is a distribution of recorded fatal attacks, not a map of infection risk.
There’s also a detail that tends to get misplaced in retellings.
Snow persuaded officials to remove the Broad Street pump handle on 8 September 1854. The outbreak was already declining. The map didn’t magically solve the epidemic with one decisive flourish.
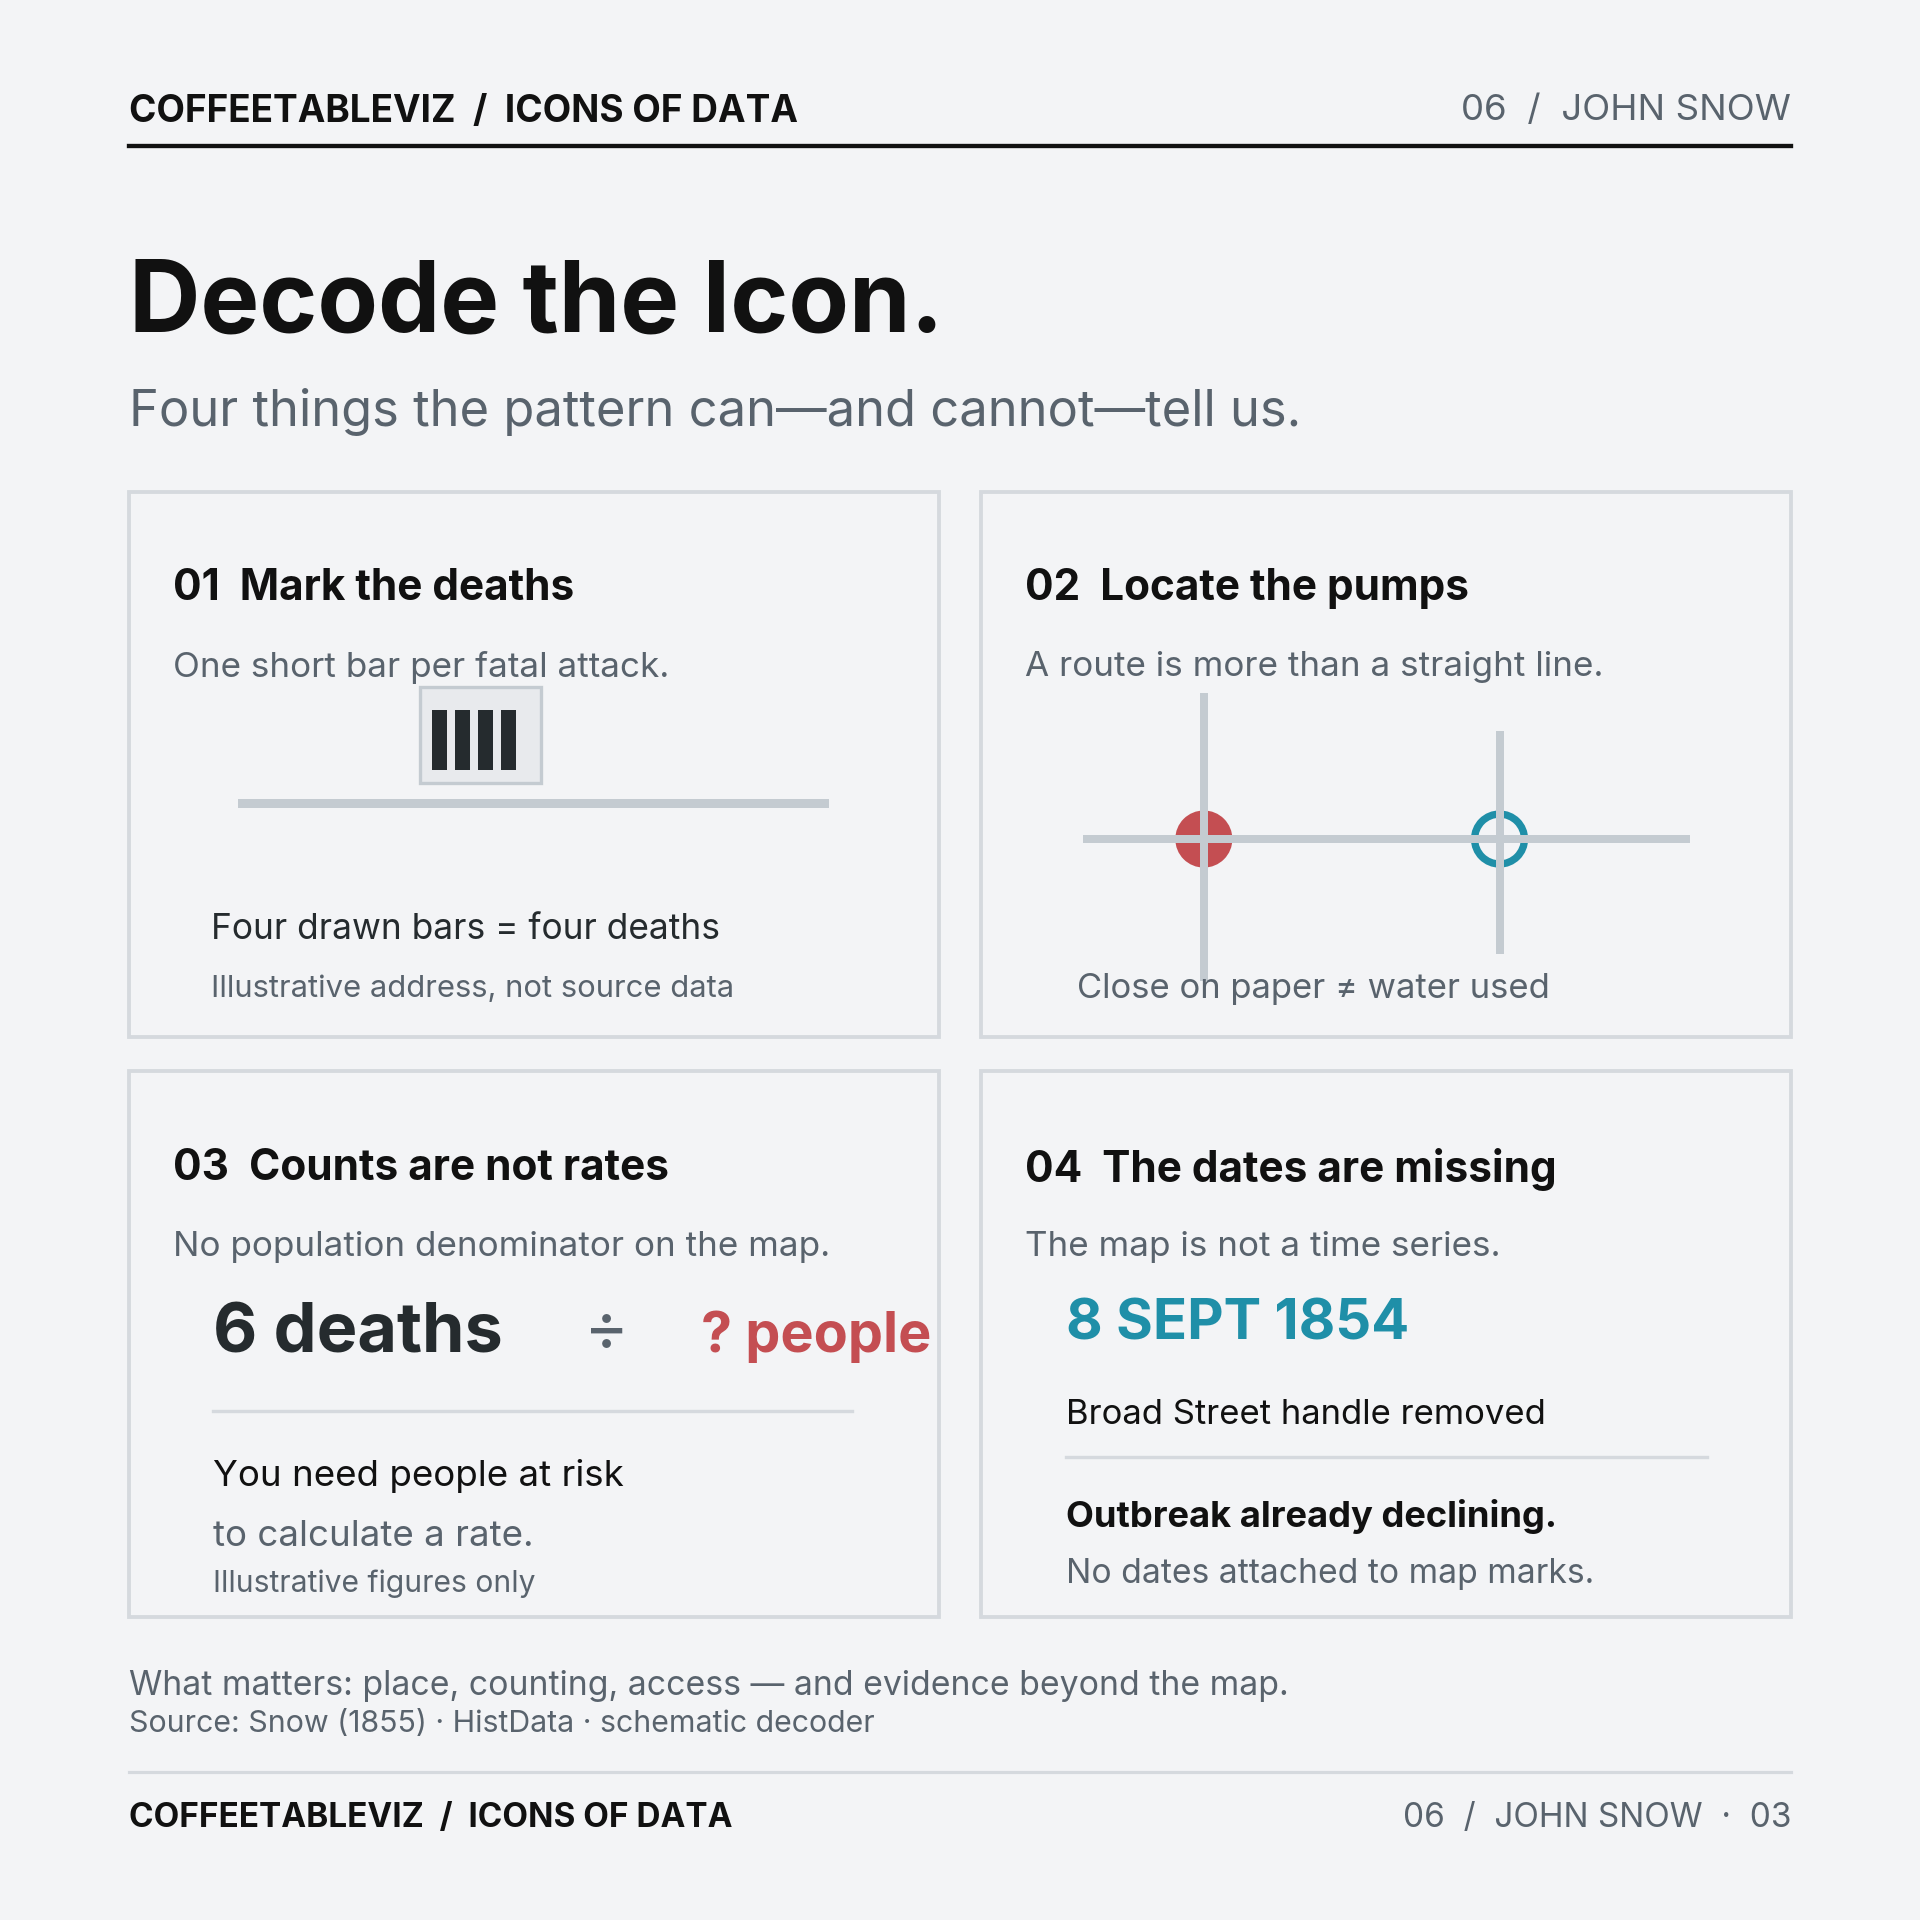
TLDR
Snow made a geographical pattern easier to see.
He also did the less photogenic work: questions, comparisons and checking unusual cases.
The map helped make his argument.
It wasn’t the whole argument.
simple charts clear stories.