Icons of Data
The chart that made disease impossible to ignore
Florence Nightingale made a case for healthier military hospitals with a striking 1858 mortality diagram. What its blue areas revealed — and what they could not prove.
A war has a fairly obvious suspect when soldiers die.
You’d probably guess battle wounds.
Florence Nightingale had some figures that made that answer rather awkward.
In 1858, she published a diagram showing what had killed British soldiers during the Crimean War. It wasn’t designed simply to look pretty.
It was designed to make a point.
The biggest problem was blue
Her diagram divided deaths into three categories.
Blue represented what she called preventable or mitigable zymotic diseases — a decidedly Victorian way of grouping illnesses such as cholera, dysentery and fever. Red meant wounds. Black covered other causes.
And blue dominated.
In a later transcription of the army’s returns, about 84% of recorded deaths in the first twelve months fell into the disease category.
Not quite the picture of war you might expect.

A rose with a rather sharp point
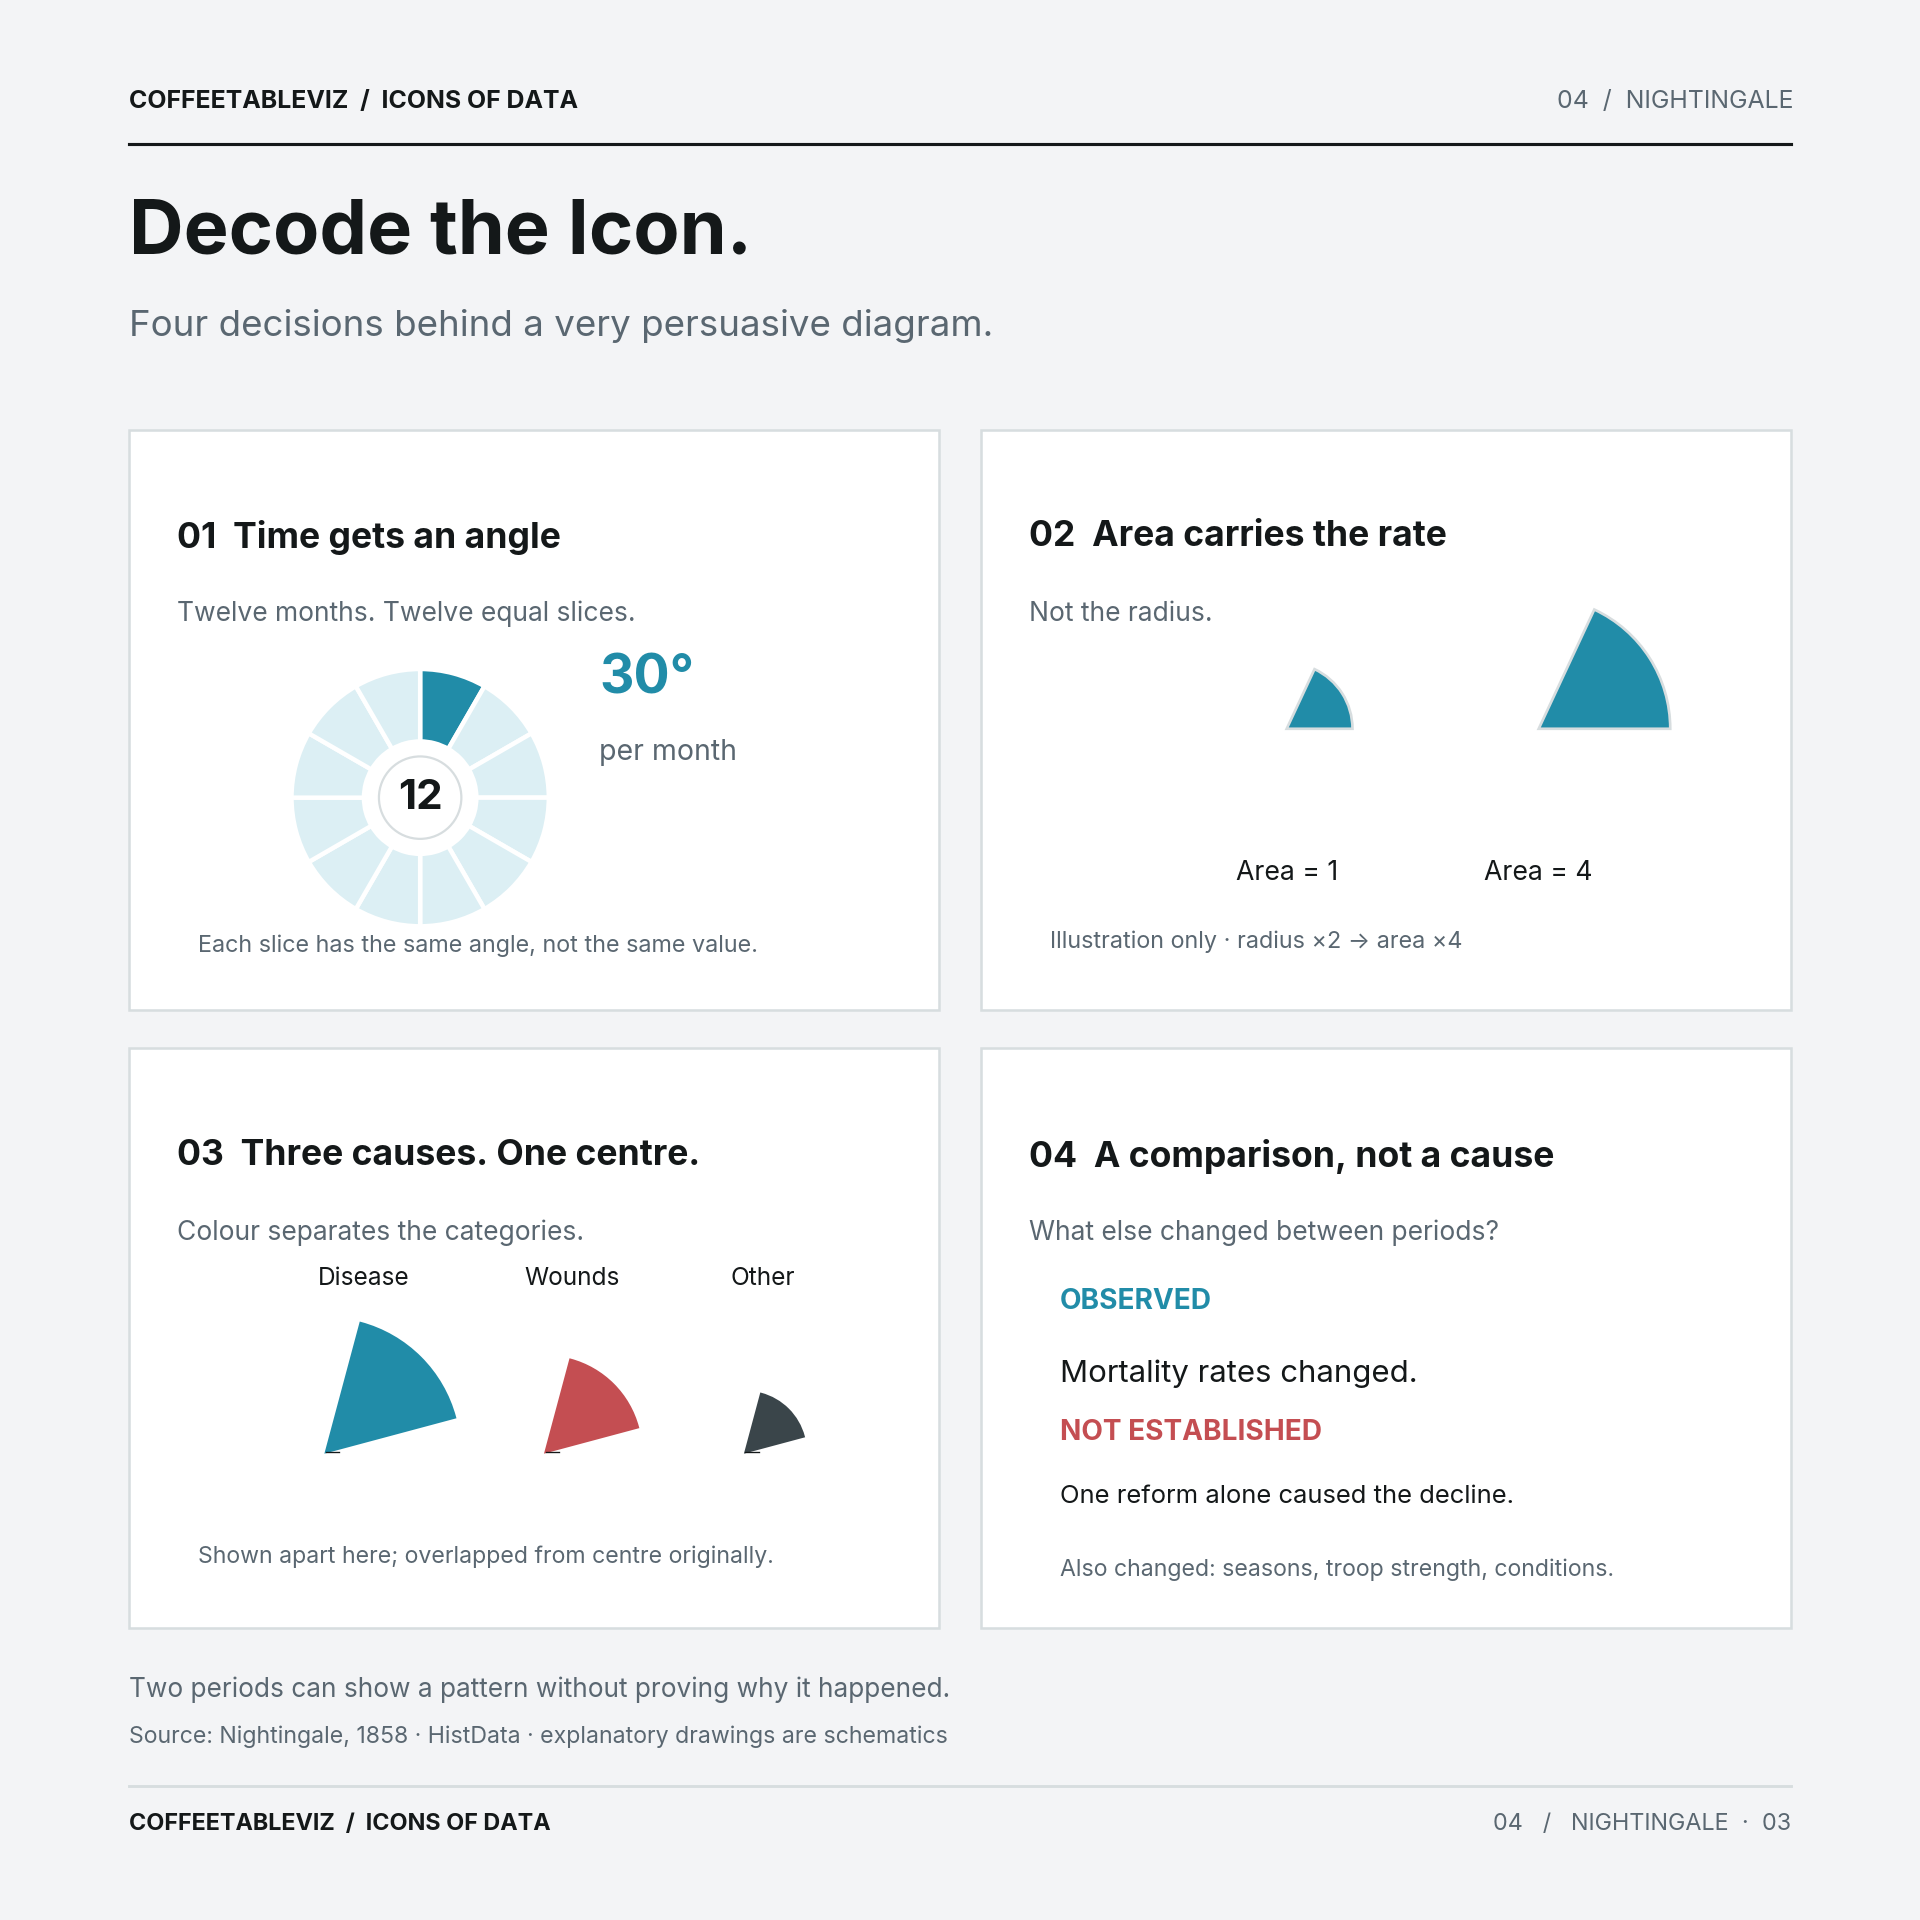
The diagram looks a little like a flower. But it’s not an ordinary pie chart.
Each month gets the same angle. The area of each coloured section represents a mortality rate, not a headcount — or simply the distance from the centre.
That last detail matters. Double a wedge’s radius and its area quadruples. Nightingale’s design accounted for that.
There are two circles: the first year of the war on the right, and the second on the left. The later blue areas are dramatically smaller.
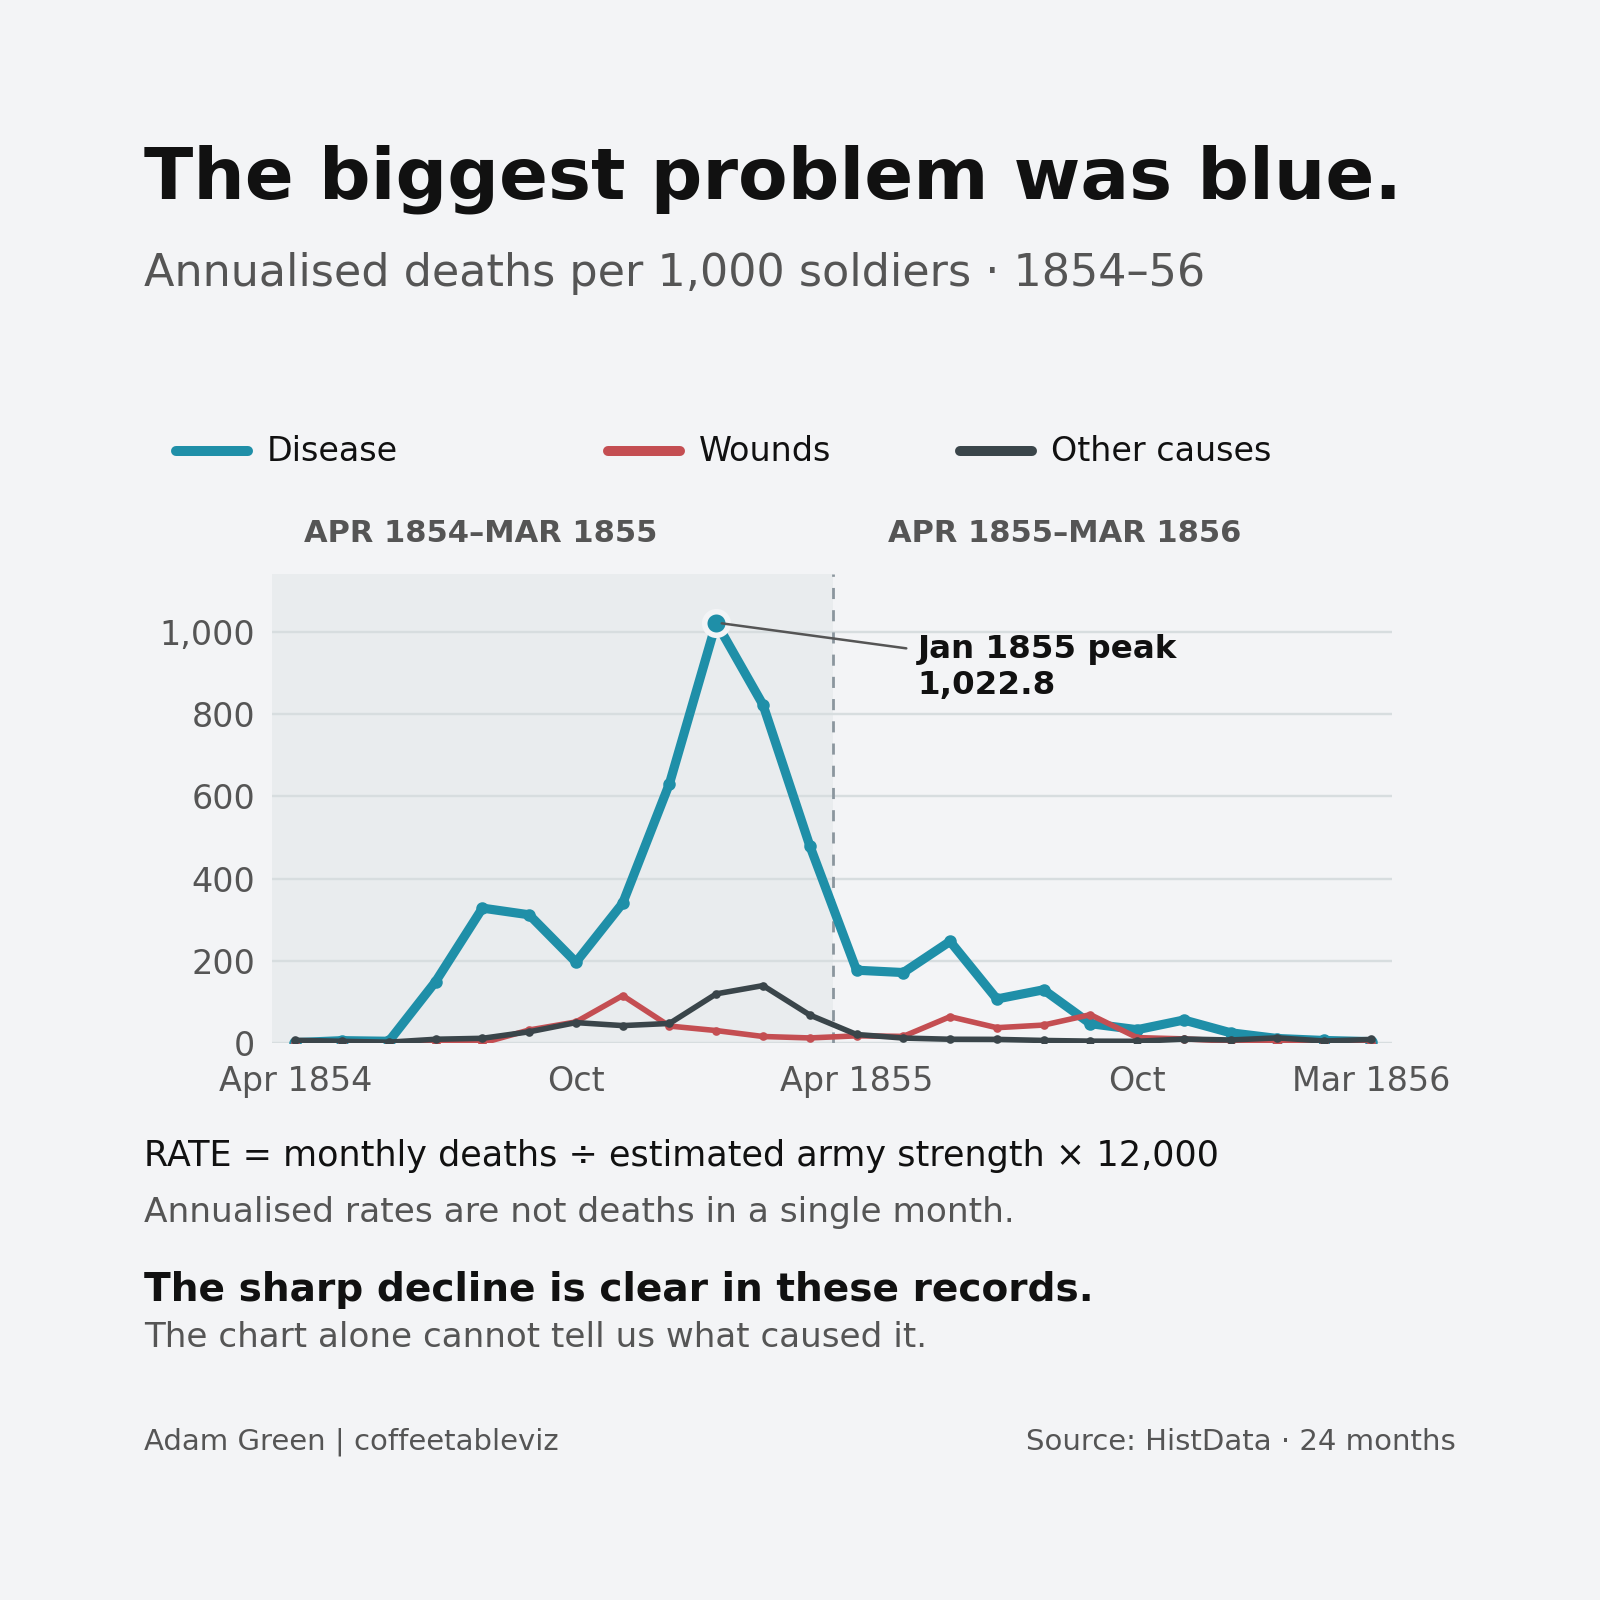
HistData::Nightingale, digitised from nineteenth-century military records. A decline is observable; this plot does not assign a cause.A chart isn’t a verdict
Sanitary improvements were made during the war, and Nightingale wanted officials to recognise the importance of preventable illness.
But the chart alone can’t tell us exactly why the death rates fell. The seasons, army strength, conditions and military campaign changed too.
Nor did she invent the polar-area chart from scratch.
What she did was make an uncomfortable comparison extremely difficult to miss.
TLDR
Nightingale didn’t just organise numbers. She organised an argument.
The colours caught your eye.
The data asked what could have been prevented.
And sometimes that’s precisely what a good chart needs to do.
simple charts clear stories.