Icons of Data
The spiral that tells a bigger story
In 1900, W. E. B. Du Bois and his colleagues used a striking red spiral to challenge what people thought they knew about Black life in Georgia. What the shape reveals — and hides.
Some numbers are so much bigger than the others that the chart becomes a bit awkward.
W. E. B. Du Bois had a solution.
He curled the biggest one into a spiral.
One very long red line
At the Paris Exposition in 1900, Du Bois and his collaborators from Atlanta University presented hand-drawn graphics about Black life in the United States.
They were showing an international audience something that racist stereotypes and national celebrations tended to ignore: evidence about real people, their circumstances and their achievements.
It was part of a much larger display of charts, photographs and books. The point wasn’t to turn people into statistics, but to challenge what other people claimed to know about them. Data had a rather important job to do.
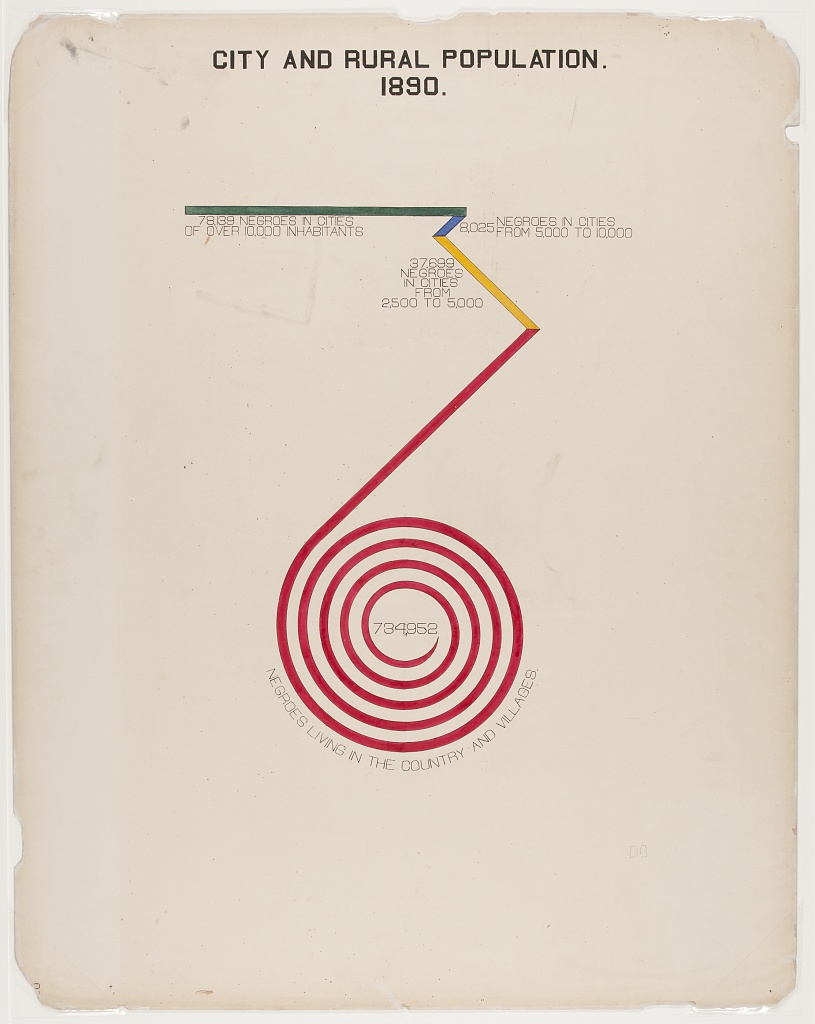
One chart was titled City and Rural Population. 1890.
It compared where Black Georgians lived.
A green line, two shorter coloured turns, and then an enormous red coil.
The rural population takes up most of the drawing, just as it took up most of the total.
It’s not exactly a bar chart.
But it’s certainly not shy.
Unwind the argument
The coil represents the people the original calls those living in “the country and villages”.
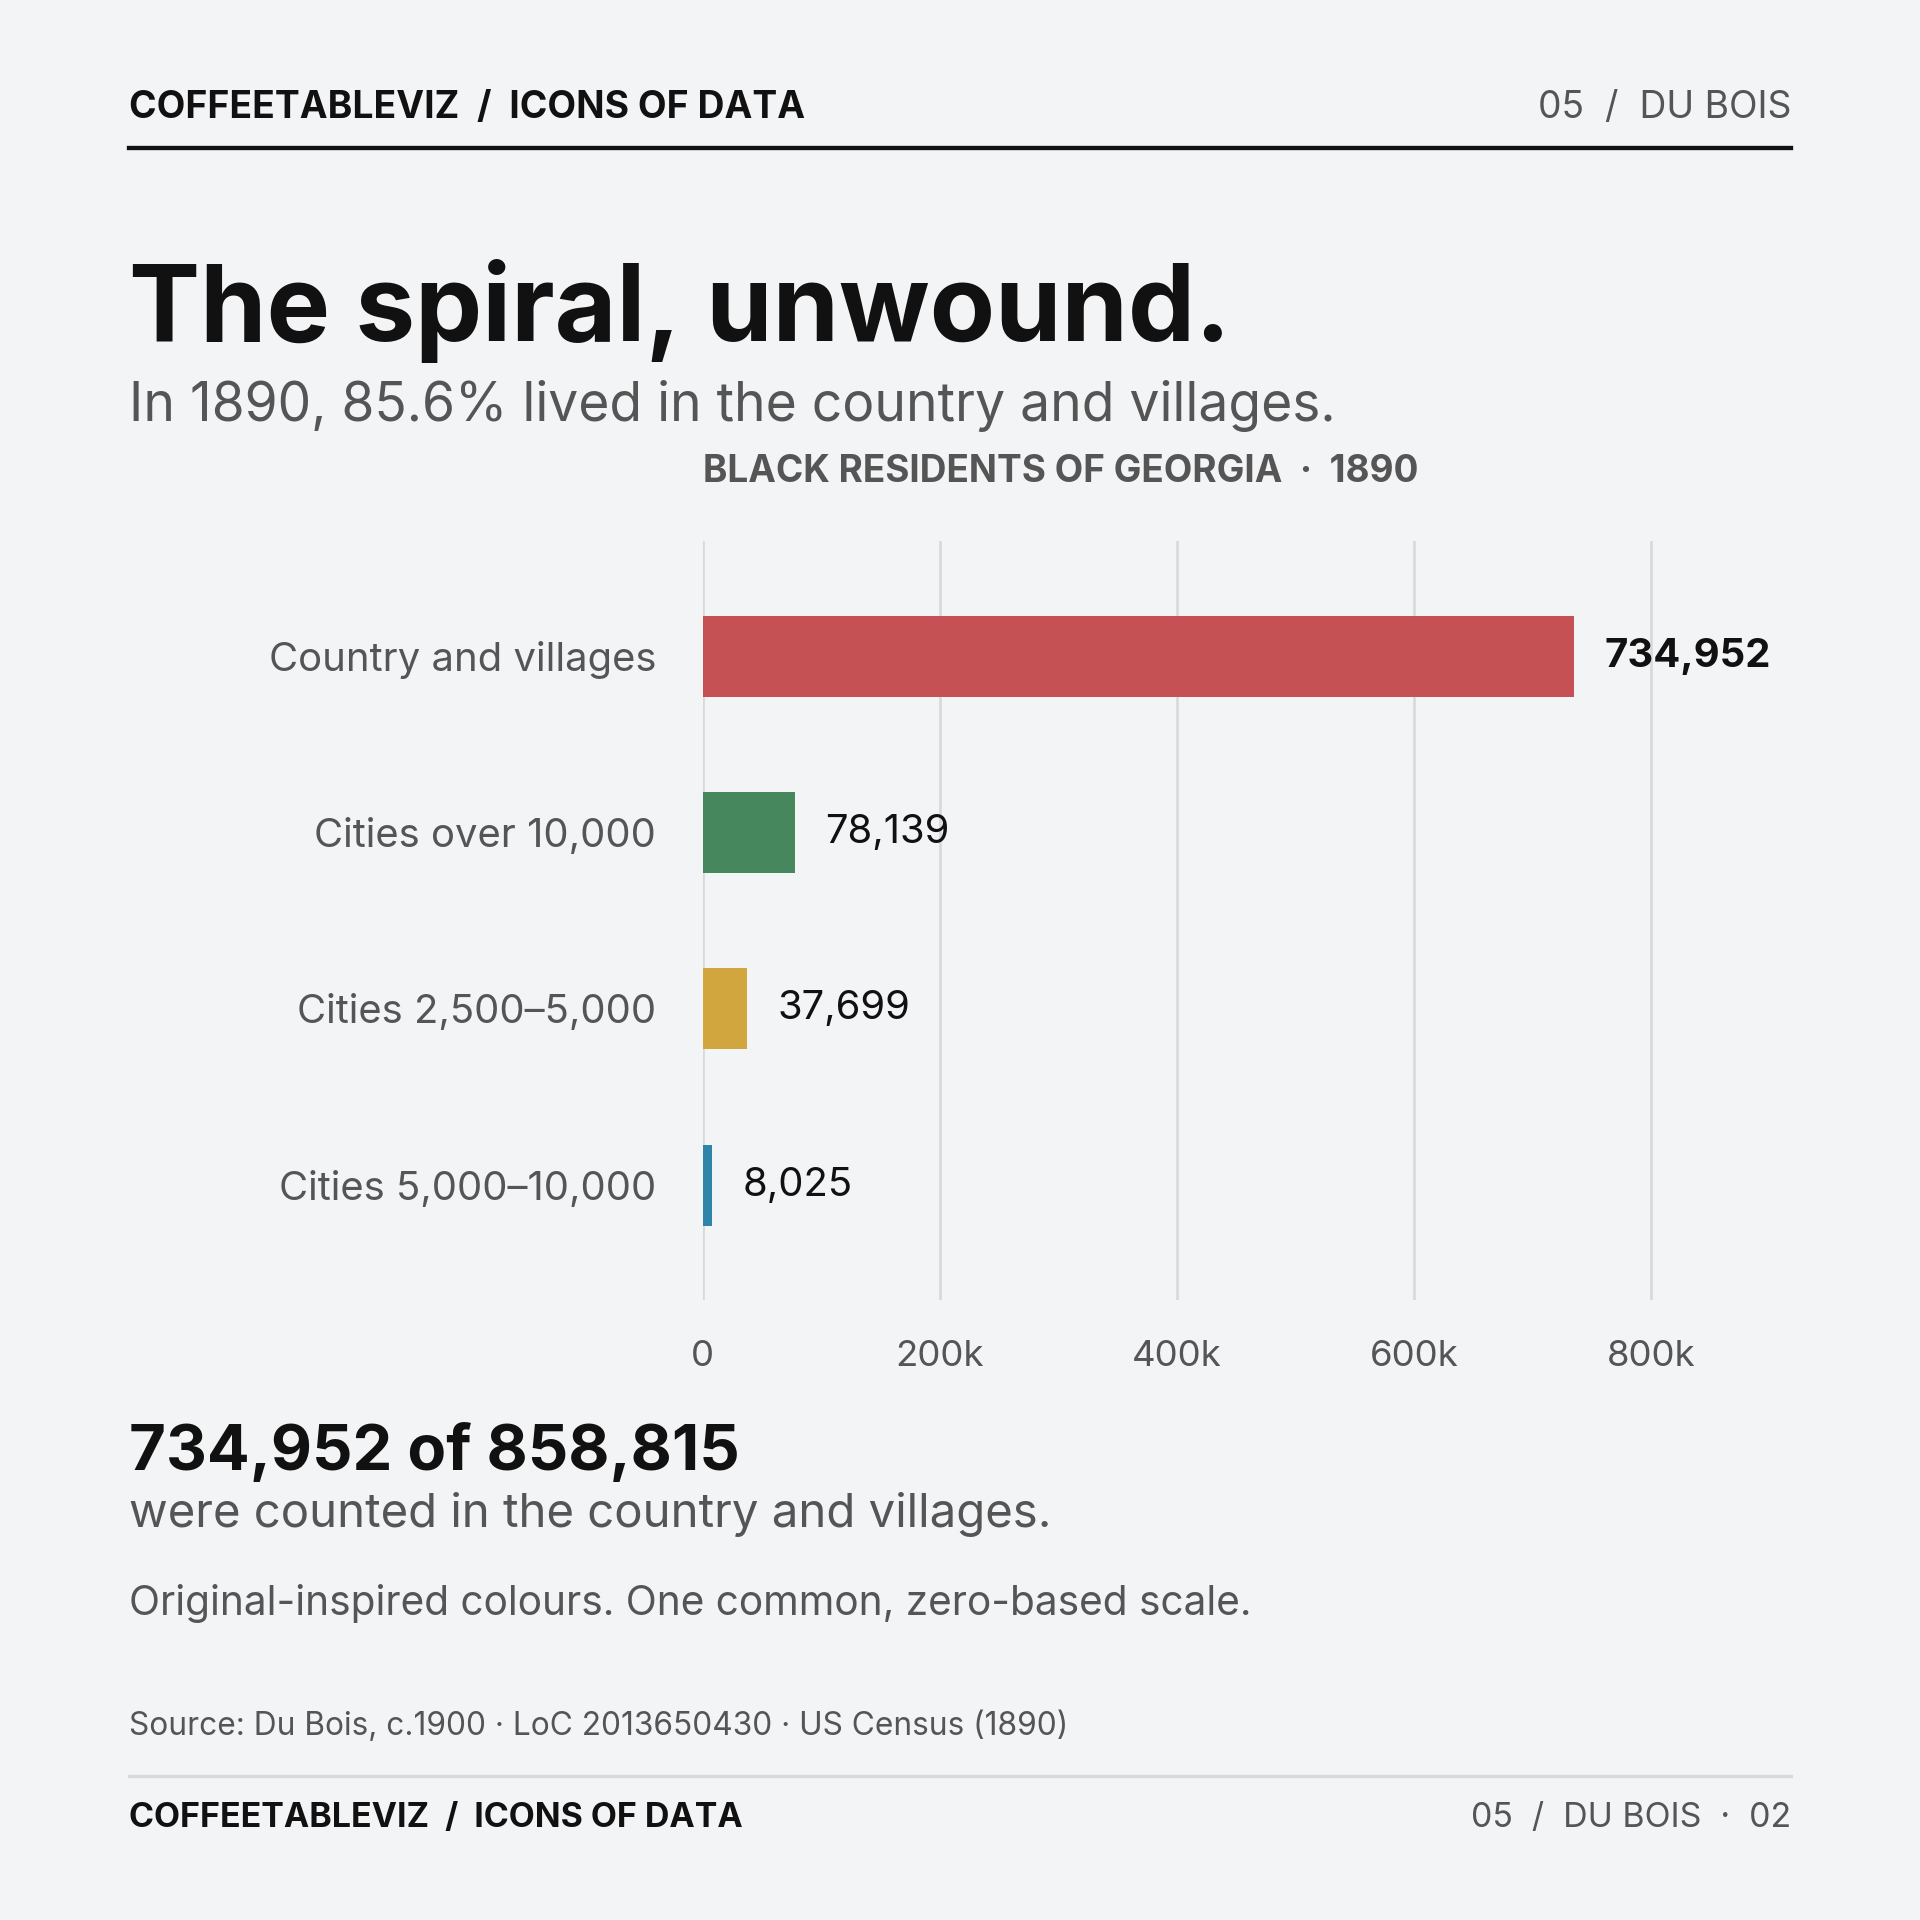
The census recorded 858,815 Black residents of Georgia in 1890. The chart’s largest printed group is 734,952 in rural areas and villages — roughly 86% of that statewide total.
Modern bars could make that comparison easier to judge.
In Du Bois’s original, though, the spiral commands the page. The drawing’s sheer scale does part of the storytelling.
And that’s a choice worth noticing.
What the spiral hides
A line that turns and curls isn’t straightforward to measure against a straight one.
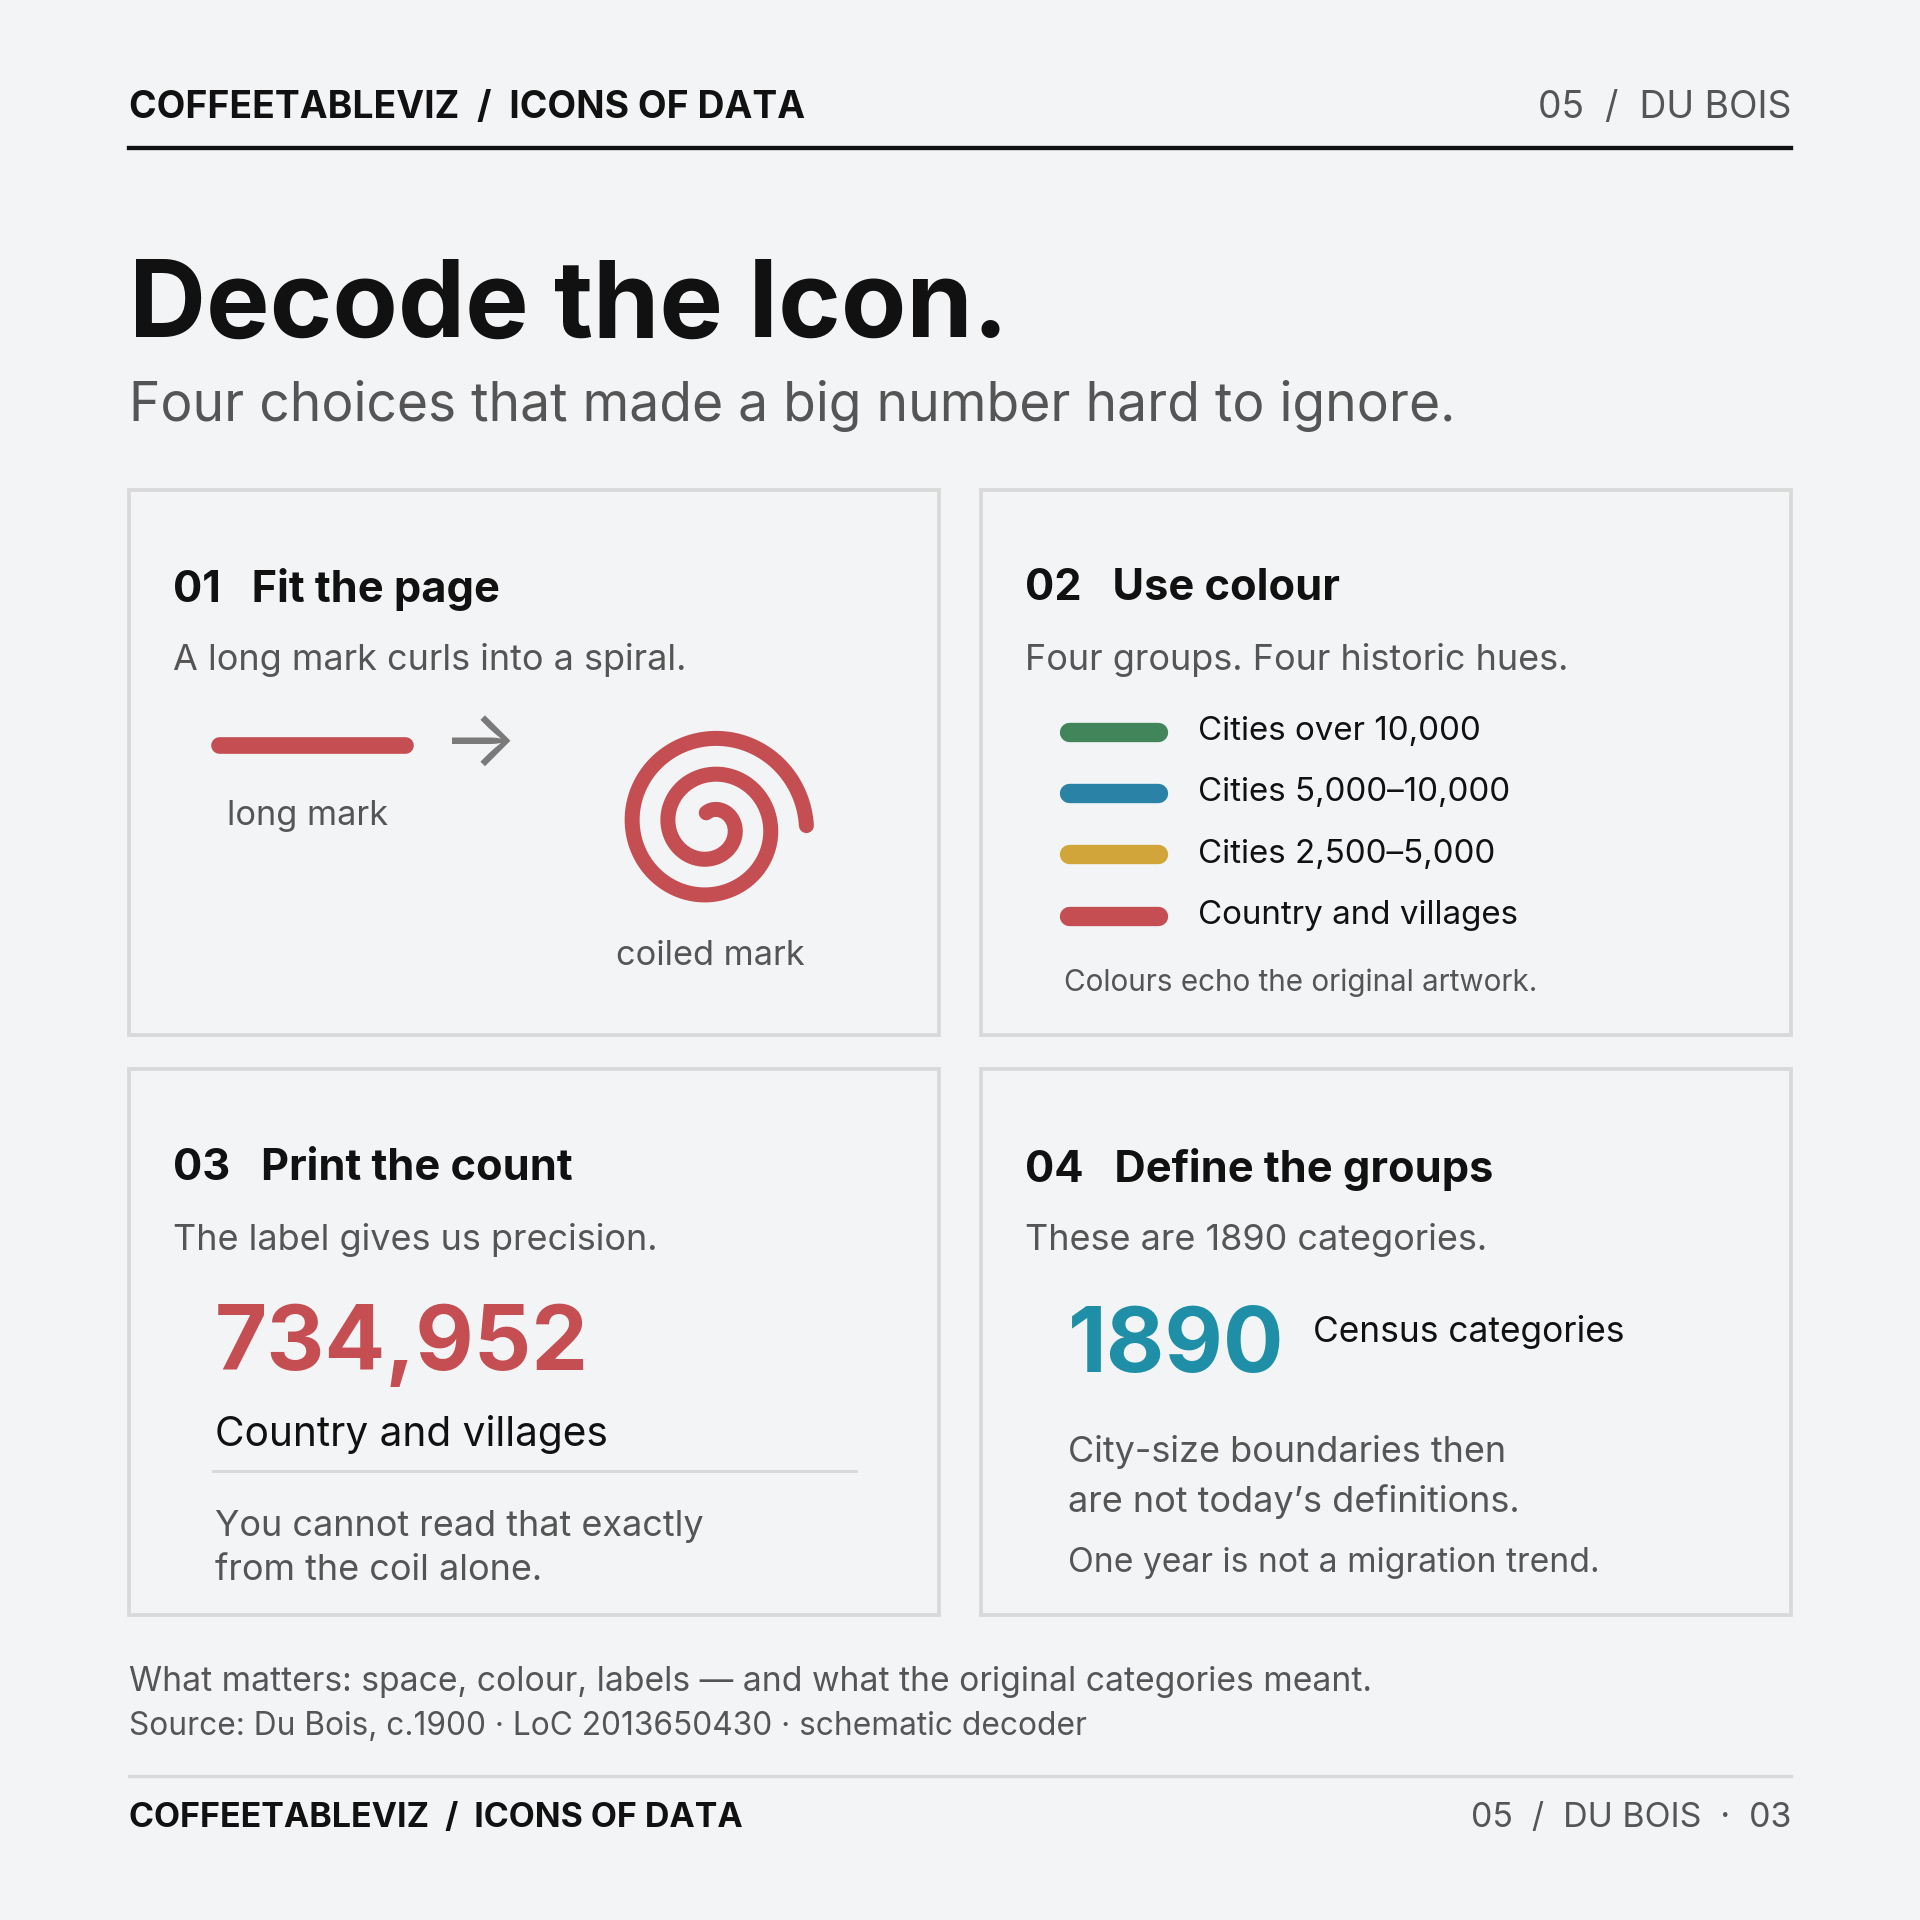
The colours help separate categories, and the printed numbers carry essential precision. Without those labels, the geometry alone is difficult to compare.
There’s another catch. The categories reflect 1890 definitions of cities and villages, not today’s idea of an urban neighbourhood. And a single census year is a snapshot, not evidence of why people moved.
TLDR
Du Bois’s team turned demographic figures into a striking argument that deserved attention.
The spiral made the imbalance impossible to miss.
The numbers made it possible to check.
One isn’t quite enough without the other.
simple charts clear stories.