Music
Every Bowie album has a shape
An album average gives you one number. Plot every David Bowie studio-album track and the catalogue looks much less tidy: long tails, short interludes and famous outliers.

The previous Bowie story, Bowie never needed the three-minute rule, used album medians because medians are useful.
They are robust, tidy and good for comparison.
They also flatten an album into one number.
So this time I plotted every canonical track across David Bowie’s 26 lifetime solo studio albums: 275 tracks in total.
Then I kept the median, added the mean, and highlighted each album’s most-streamed matched track.
The result is fairly simple:
every Bowie album has a shape.
Distribution is the story
A median tells you where the middle sits.
A mean tells you whether a few unusually short or long tracks are tugging the centre around.
Plot every track and you can see when those two summaries agree — and when they do not.
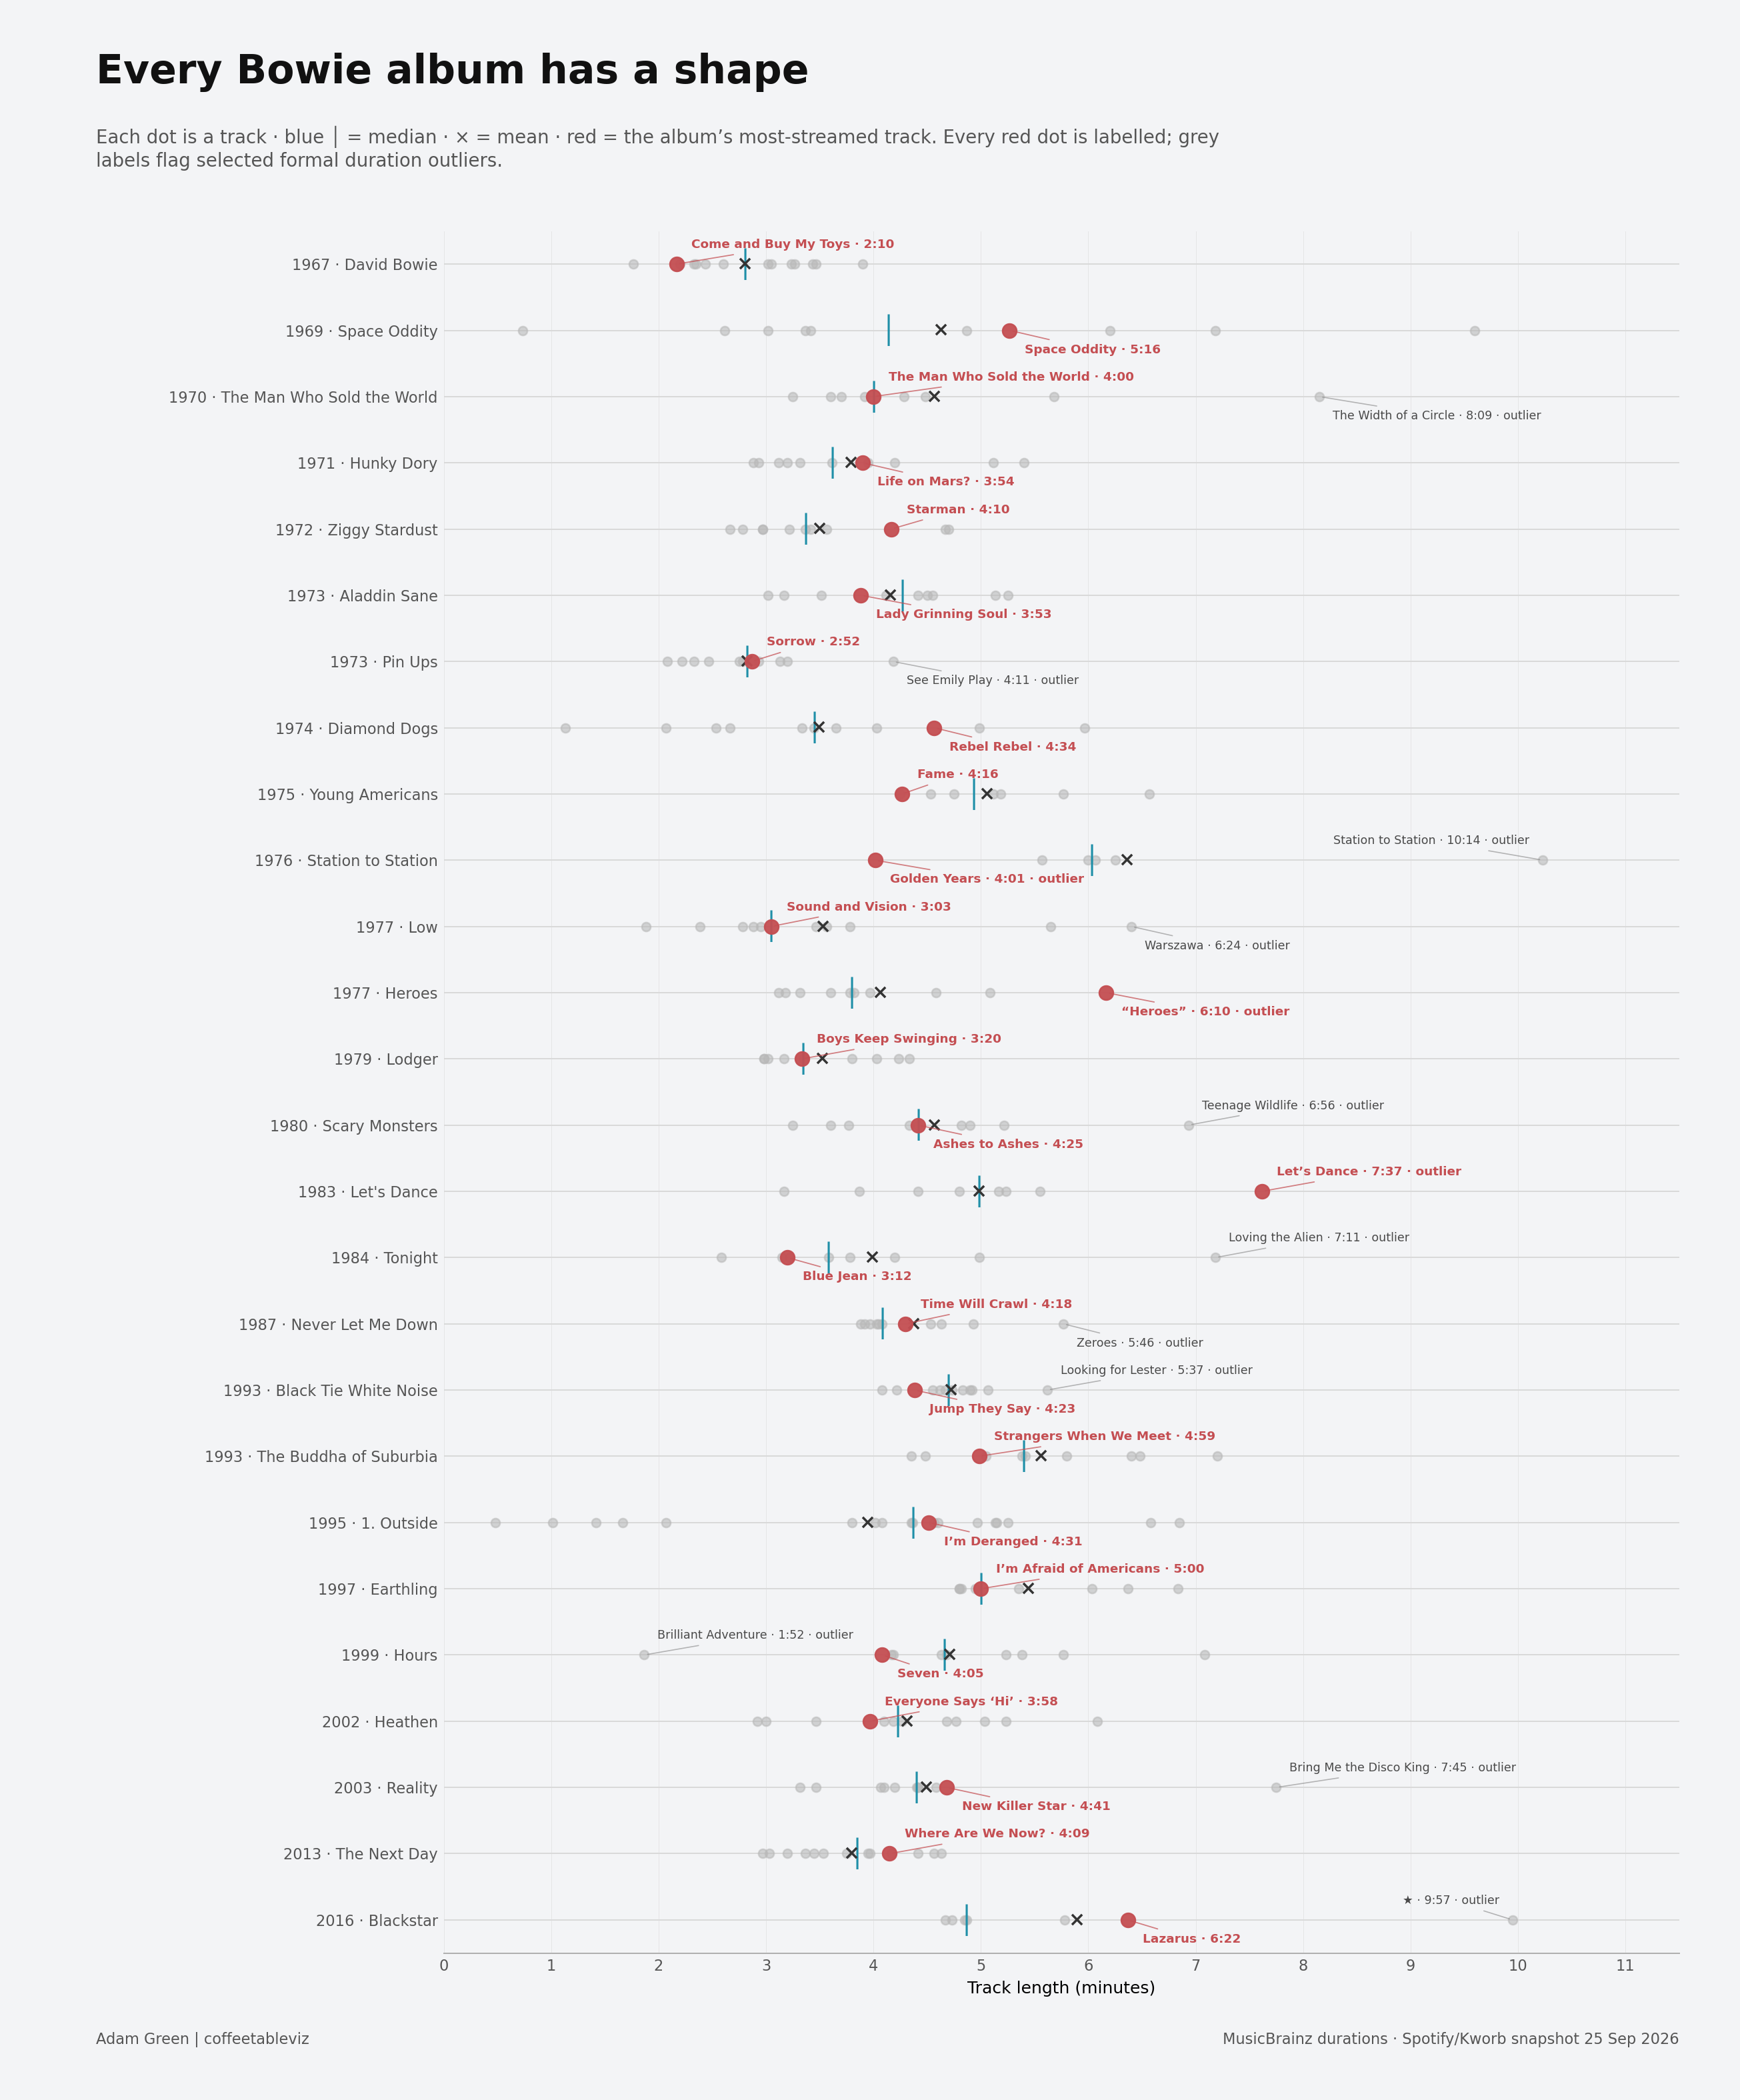
Some albums are tightly packed.
Others are stretched by one or two tracks sitting a long way from the rest.
That is why distribution matters.
The average is not wrong.
It is just not the whole story.
Mean and median can disagree for a reason
Take Blackstar.
Its median track length is 4:52, but the mean rises to 5:53 because the 9:57 title track pulls the average upwards.
Now compare that with 1. Outside.
There the pattern flips.
The album median is 4:22, but the mean falls to 3:56, helped down by several short segue-like tracks.
The gap between mean and median is not statistical trivia.
It tells you something about the shape of the album.
The famous track is not always the typical track
This is the bit I like most.
On Let’s Dance, the album’s most-streamed track is “Let’s Dance” at 7:37, well beyond the 4:59 median.
On “Heroes”, the title track sits at 6:10 against a 3:48 median.
Then Station to Station does the opposite.
Its most-streamed track is “Golden Years” at 4:01, while the album median is 6:02.
So the song people return to most is not necessarily the song that best represents the album around it.
Obvious once you see it.
Less obvious when the album is one average.
Outliers are part of the point
Using Tukey’s standard 1.5 × IQR rule within each album, 13 of the 26 albums contain at least one formal track-length outlier.
That includes tracks such as:
- The Width of a Circle — 8:09
- Station to Station — 10:14
- Warszawa — 6:24
- Loving the Alien — 7:11
- Bring Me the Disco King — 7:45
- ★ — 9:57
They are not awkward leftovers to trim away.
In several cases, they are exactly what gives the album its shape.
TLDR
Across 275 canonical Bowie studio-album tracks, the interesting thing is not just whether the songs got longer or shorter.
It is that the albums have different internal shapes.
Some are tight. Some are lopsided. Some are stretched by one famous outlier. Others put their most-streamed track somewhere completely different from the middle.
The mean helps.
The median helps.
But the real story is the distribution.
simple charts clear stories.