Design
Creating for fun
Creating for fun Push your skills, break the rules and bring those creative ideas to life. Create for fun for the ultimate viz satisfaction.

It’s easy to see analytics tools like Tableau as strictly business-focused. Many analysts might spend hours behind the screen, focused on corporate dashboards, reports, and KPIs. However, while Tableau excels at traditional data analysis, it also serves as an impressive canvas for creativity. When I use Tableau for fun, I can explore unique visualisations, experiment with data, and bring artistic concepts to life.
I’d like to share why I use Tableau as my creative outlet, for fun, in my limited free time.
Why do I Create for Fun in Tableau?
Tableau’s flexibility and depth make it perfect for going beyond the basics. When I create without the pressures of business requirements, the only limiting factors are my creativity and my skill to execute my ideas on the almost boundless canvas.
• Push my Skills: Experimenting with Tableau in a casual setting allows me to hone my skills without constraints. Whether I’m exploring new chart types, trying my hand at advanced calculations, or trying out colour combos or different layouts. The more i experiment, the better I become at visualising data in creative ways (subjective opinion 🤣).
• Creative Outlet: Data visualisation can be artistic! Creating for fun helps the inner designer in me, think about analysis from a different perspective and focus on storytelling in new ways. Tableau can become a canvas for digital art.
• Discover Hidden Features: When not focused on business outcomes, I’m more likely to play around with Tableau’s lesser-known features. Mastering table calculations, mapping and map layers, and custom visuals i might never use otherwise in a business context.
• Bring Abstract Concepts to Life: Using Tableau to bring to life abstract ideas or by bringing unconventional datasets into a dashboard helps tell more creative stories. The joy of creating something unconventional, like visualising my favorite songs, films or personal data, is deeply rewarding.
What are my go to Fun Projects to Try in Tableau
Here are some creative projects I use to step outside the business box:
1. Visualising Music
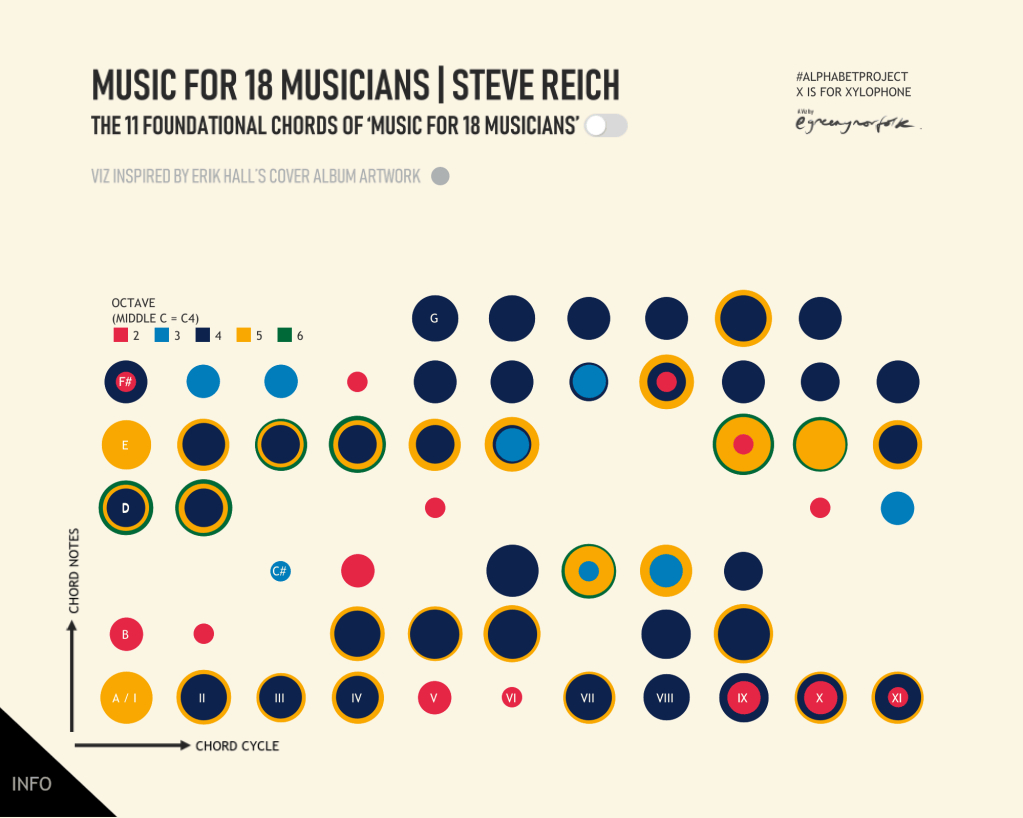
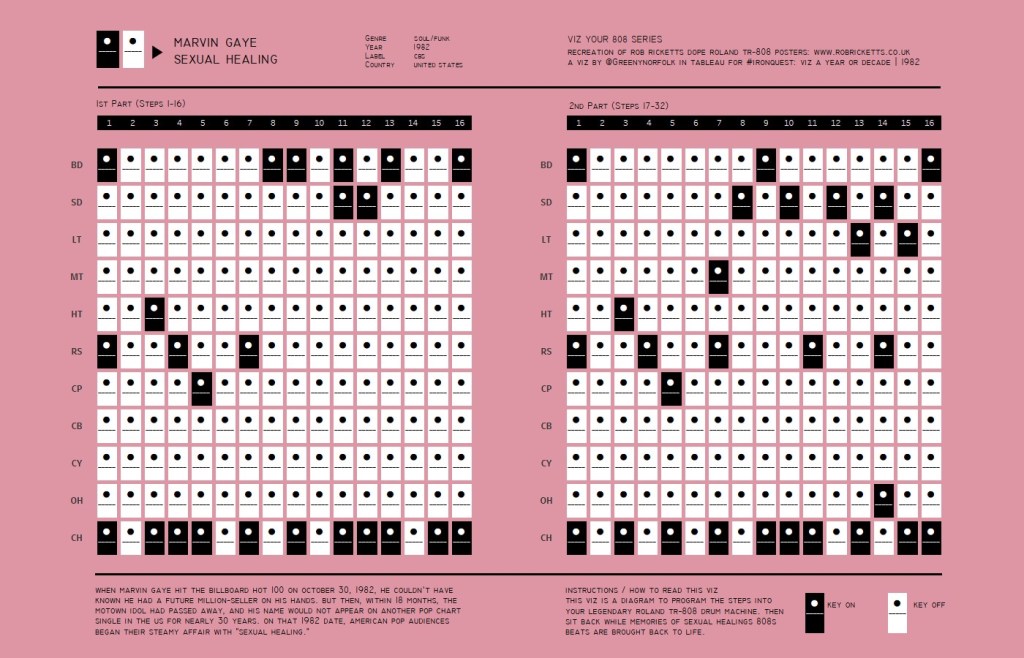
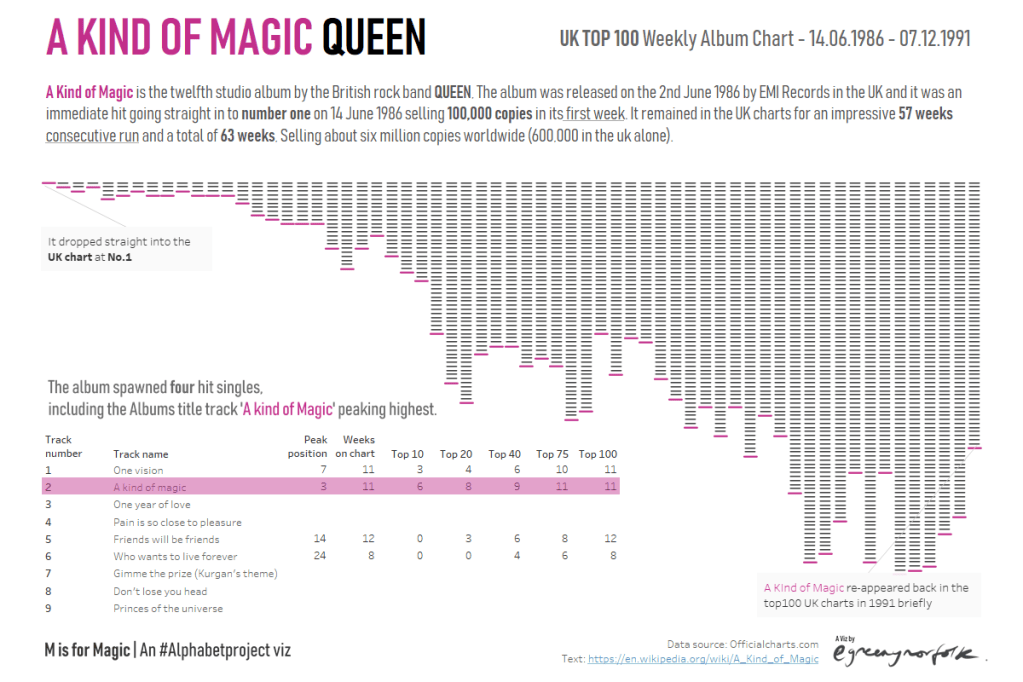
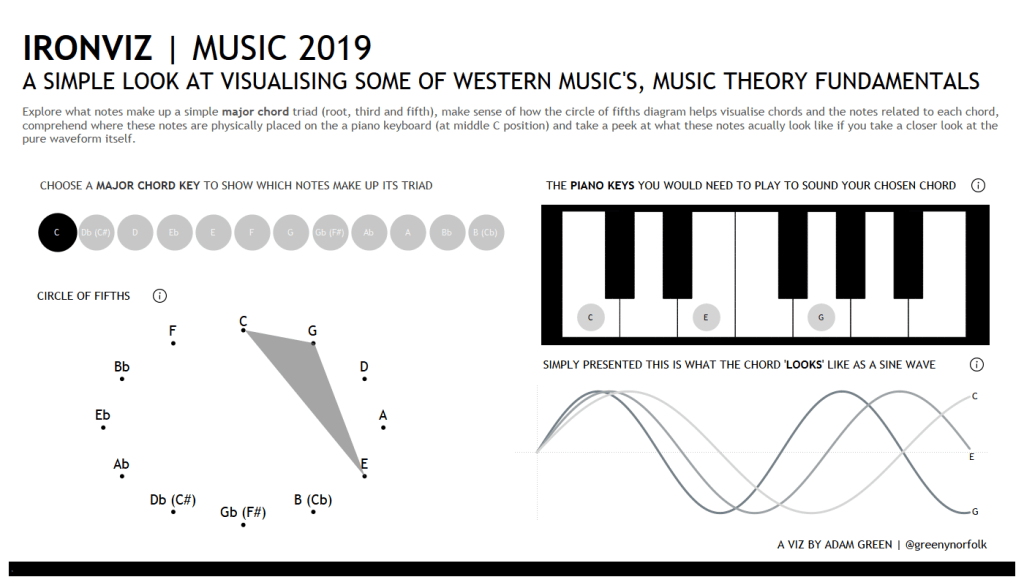
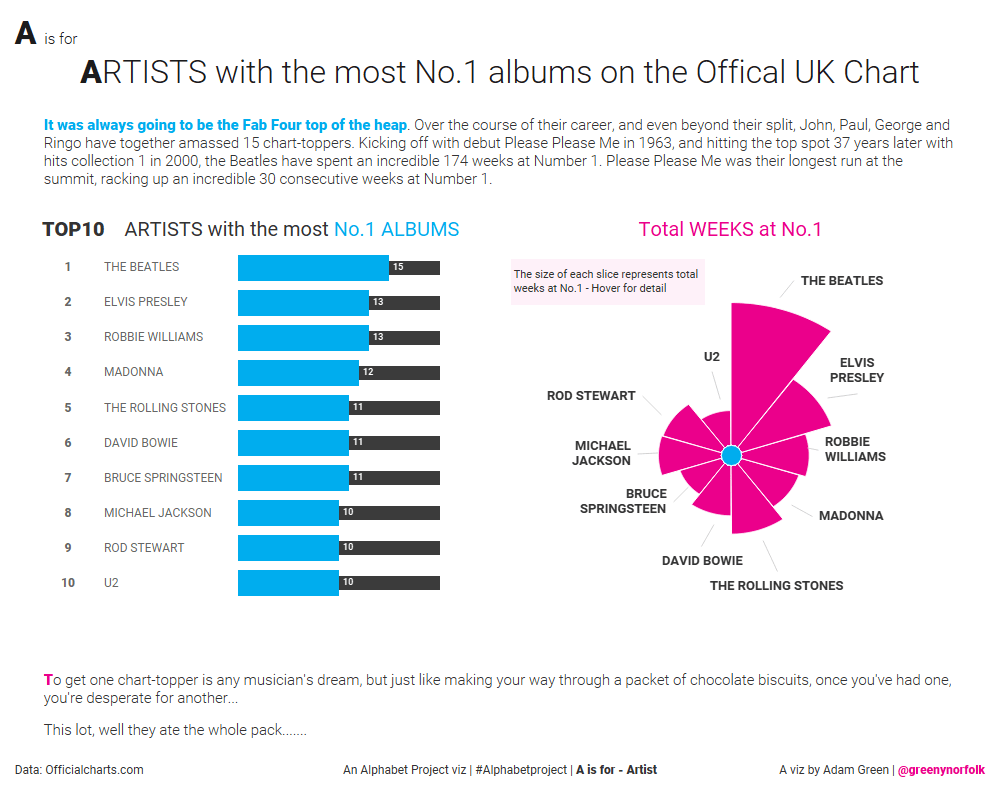
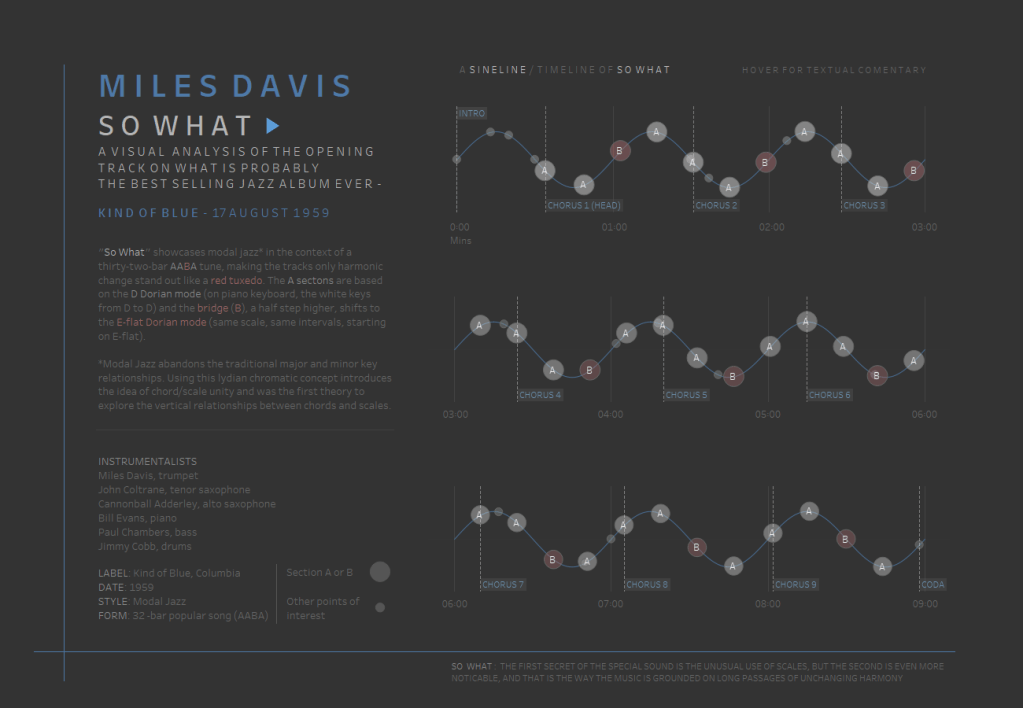
• Use Tableau to create a visualisation of your favorite songs, artist/bands and chart standings. Plot midi file data in Tableau to present the pitch and orchestration or analyse chord progressions and motif development.
2. Data Art
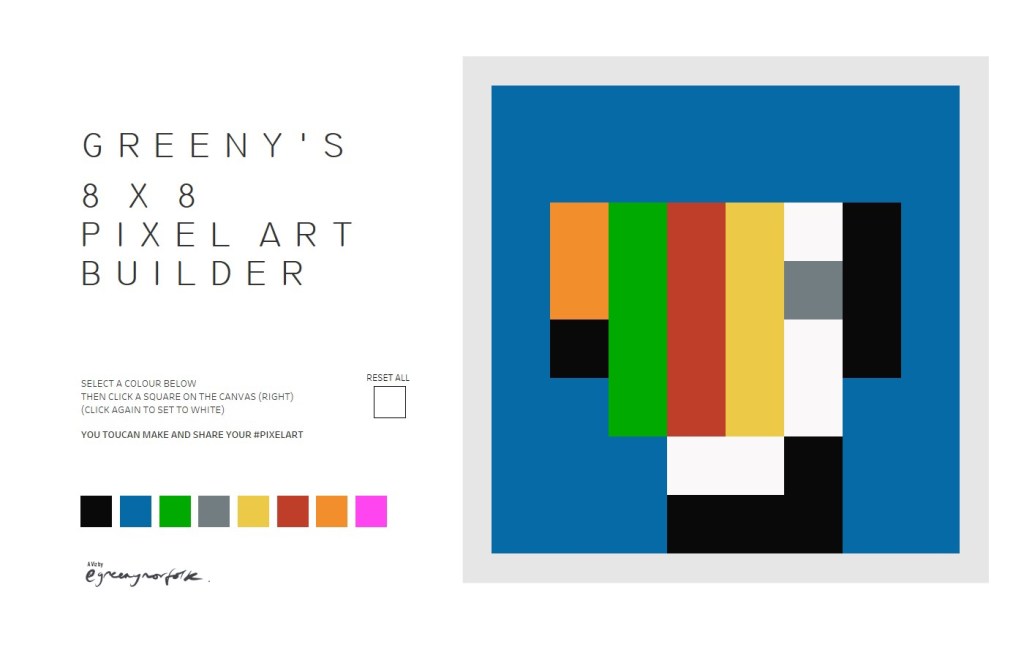
Try it yourself: The 8×8 Pixel Art Builder is now a little interactive studio right here on coffeetableviz. Pick a colour, make something gloriously blocky, then download or share it.
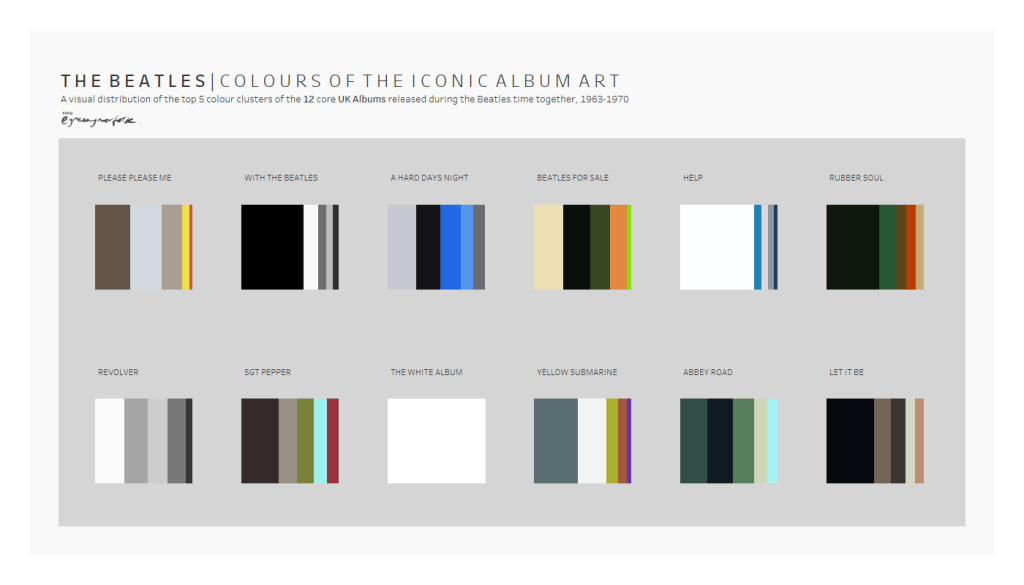
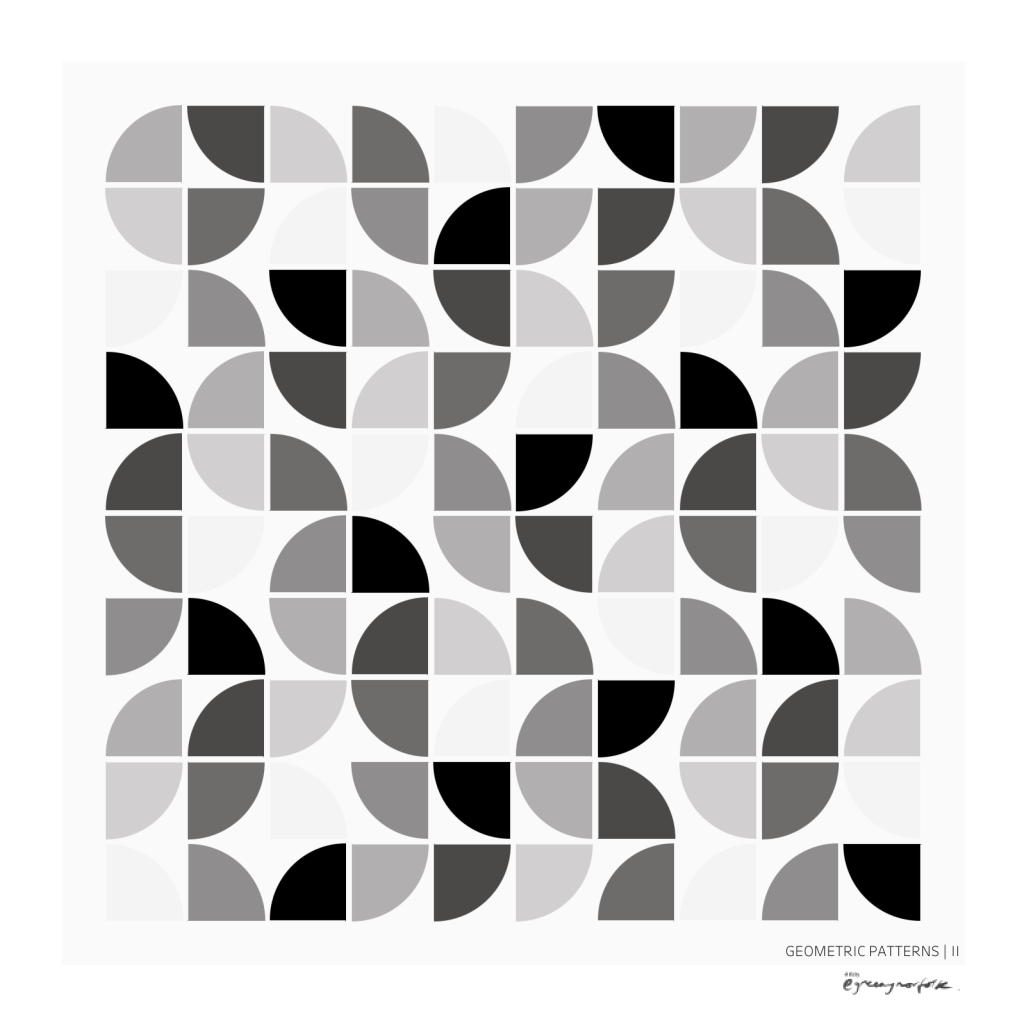
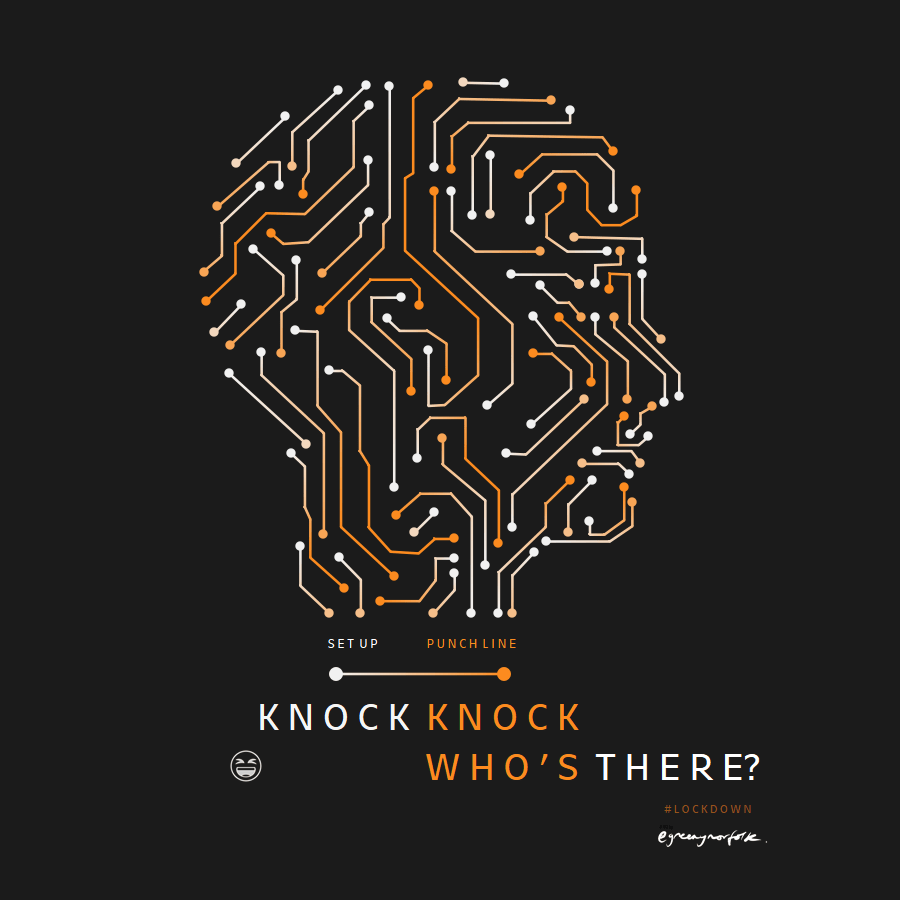
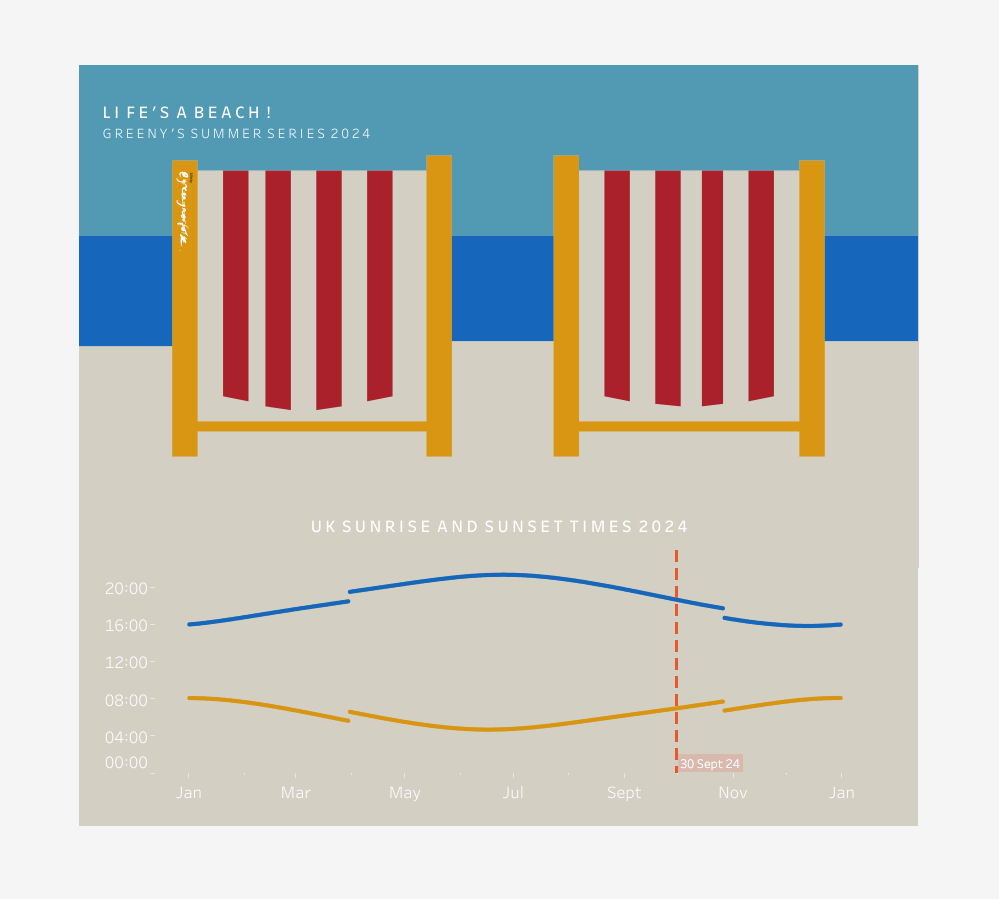
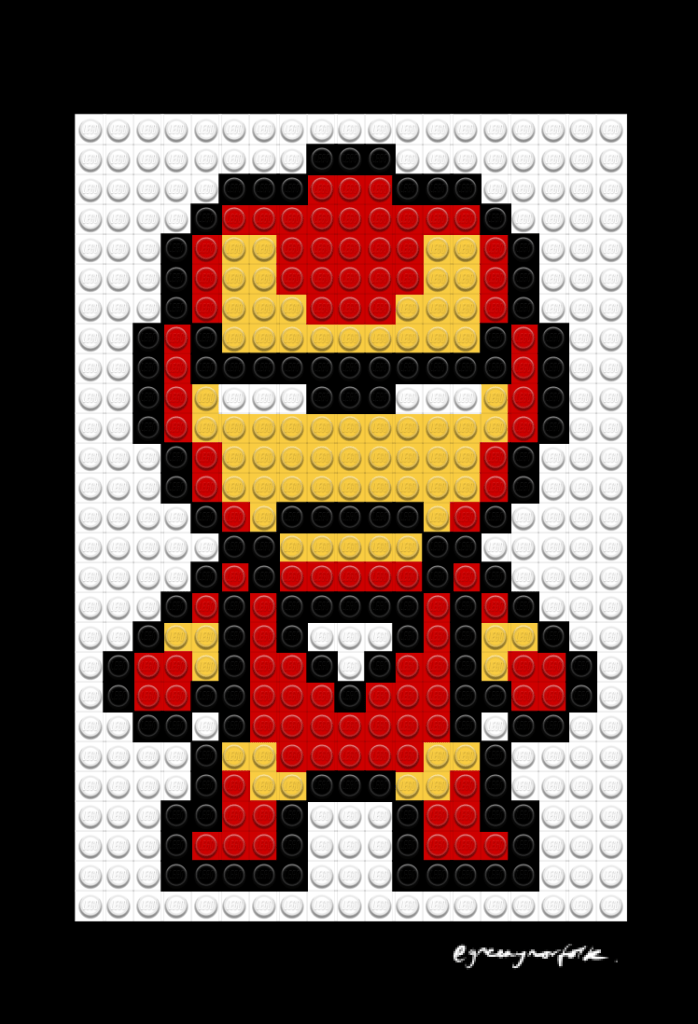
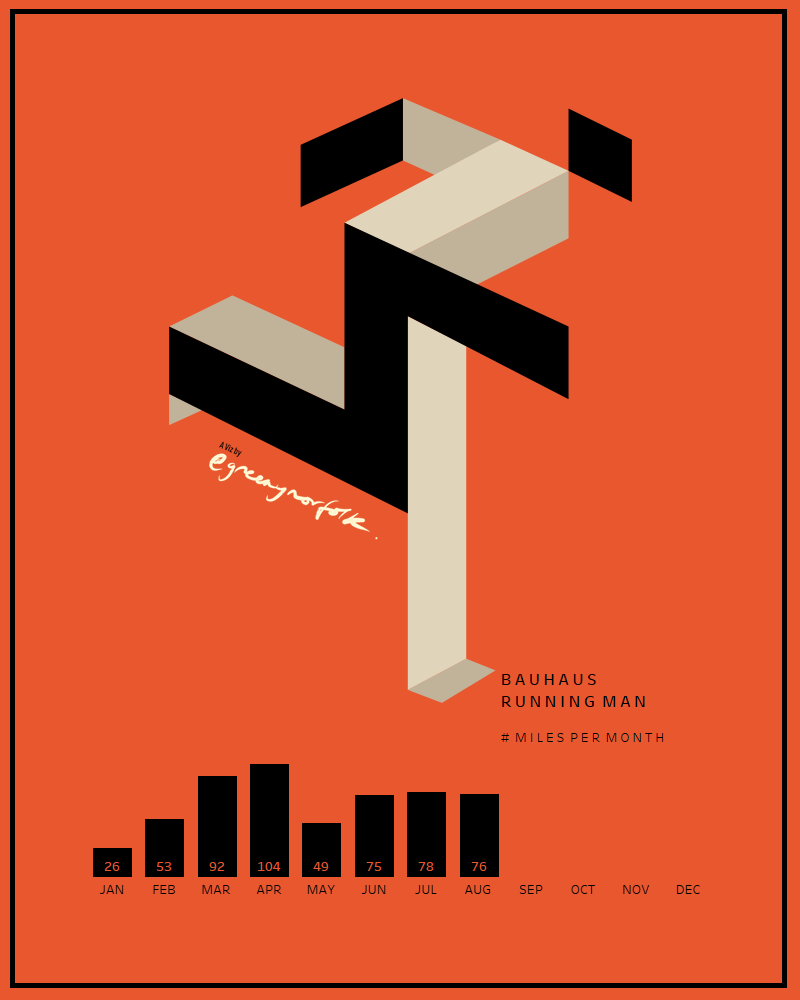
• Tap into Tableau’s artistic potential by creating data art. This could mean arranging shapes and colours to represent a dataset visually, using coordinates to create patterns or even abstract images. Data art doesn’t have to be logical, you make the rules, it just needs to be visually engaging.


3. Personal Data Projects and data that’s personal to you
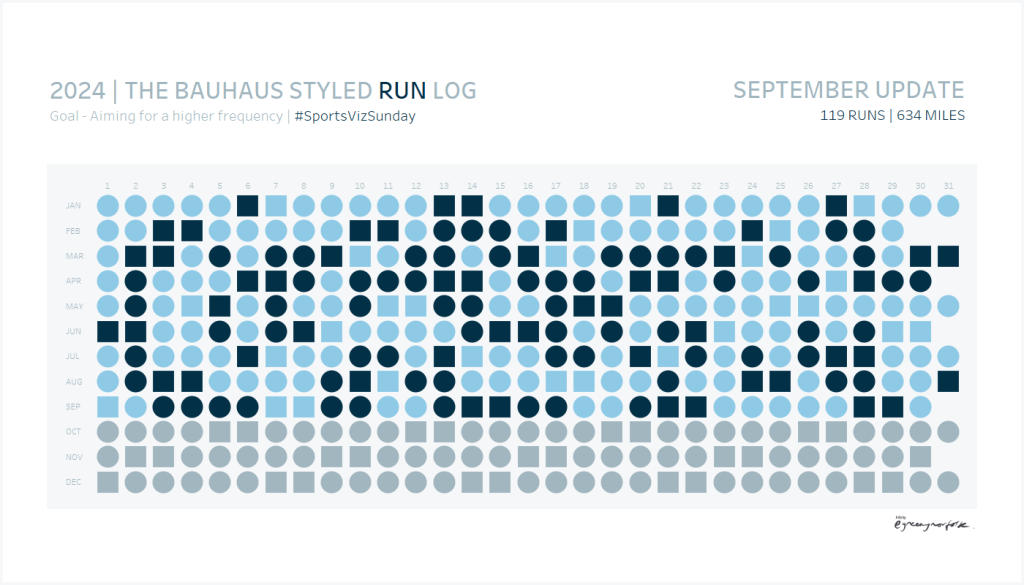
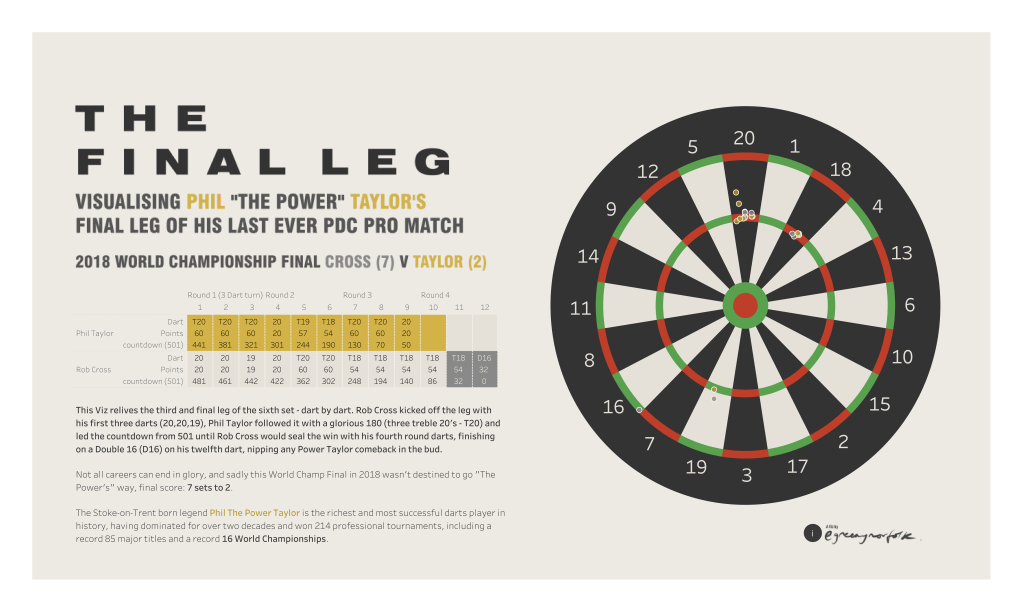
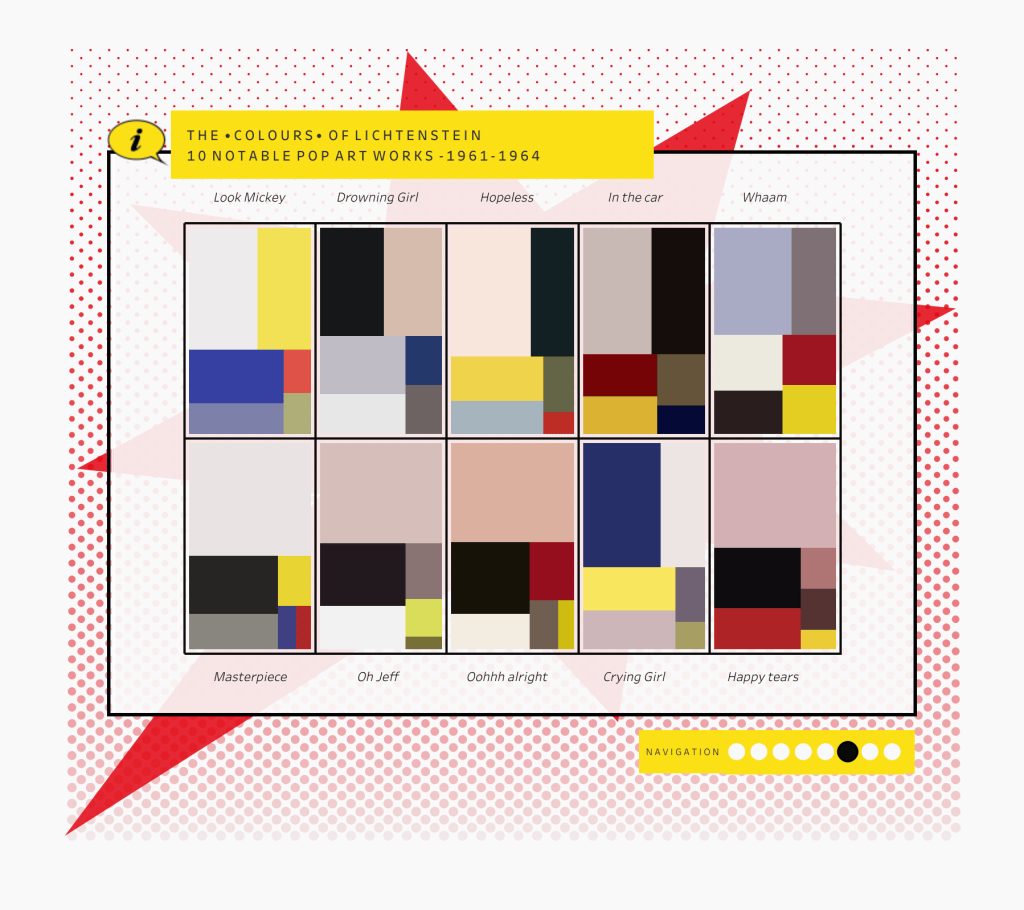
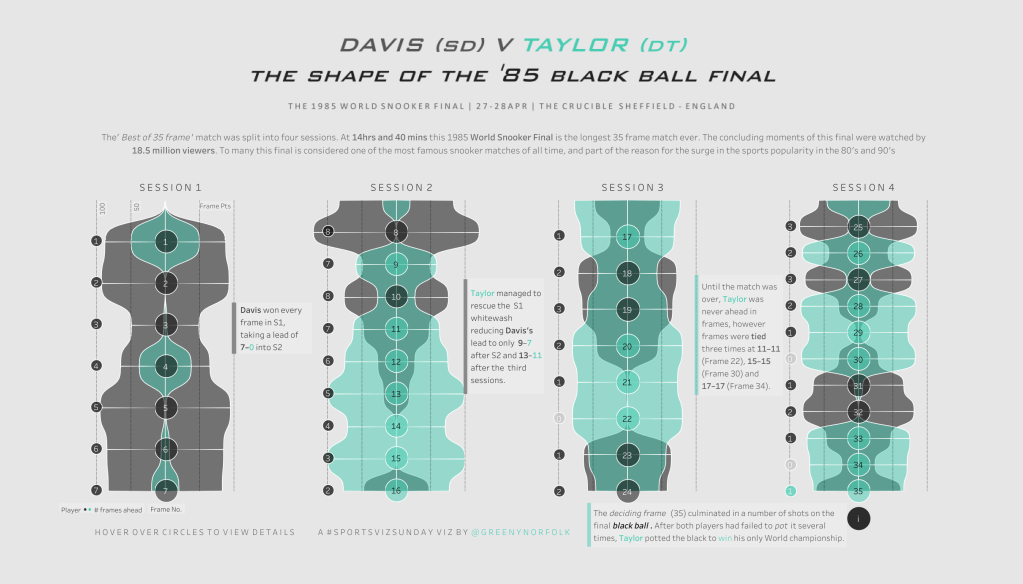
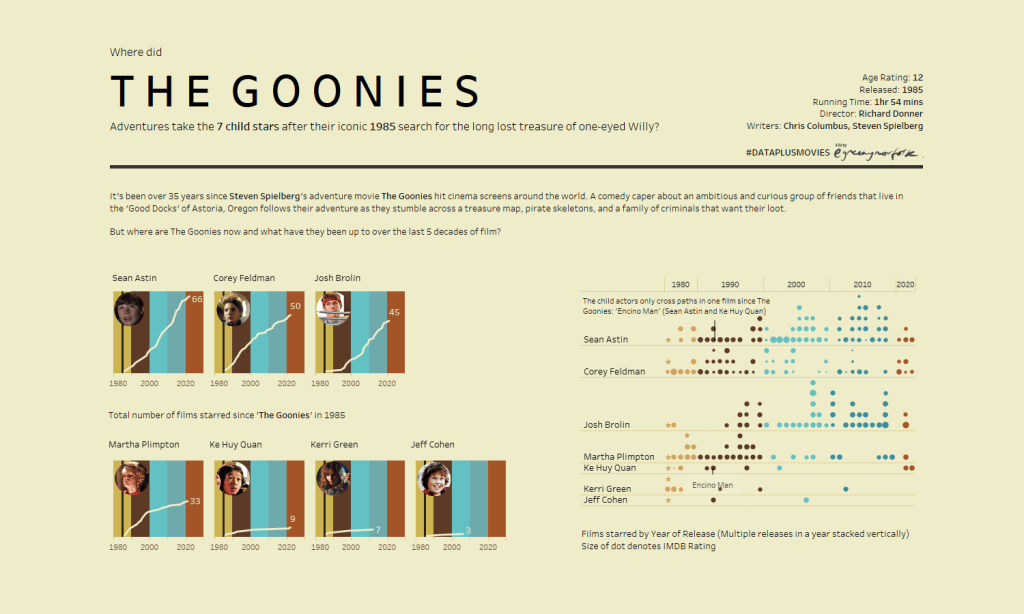
• Track your daily habits, such as runs completed, films and actors you like, visualise iconic sporting events or art and artist you admire. Collate your own data to build something personal and visually interesting. It’s a great way to add a personal touch to your Tableau portfolio!
My tips for having the most fun in Tableau
• Create something different: When working on personal projects, think outside the box, try out more creative colour schemes, fonts and chart choice. Experiment and find a unique style that stands out.
• Play with Interactivity: Use actions, filters, and tooltips to make your dashboards interactive. This adds layers to your visualisation, giving users an immersive experience.
• Break the Rules: Forget about “best practices” and let yourself experiment. Add elements just because they look good or serve an artistic purpose.
• Look for Inspiration: Check out Tableau Public to see what others are creating for fun. The platform is filled with dashboards that explore unconventional subjects, from pop culture to personal hobbies.
Making Fun Creations on Tableau Public
Tableau Public is the perfect platform to share your creations with the world. It’s free, and has an amazingly strong #datafam community who appreciate unconventional uses of data visualisation. By sharing your work, you can gain feedback, connect with other likeminded folk and even inspire others to try new things.
Creating for fun in Tableau can be a refreshing way to see data through a different lens. It’s a reminder that data visualisation isn’t just about communicating numbers but can also be a form of expression. Whether you’re visualising music, art, sport, or just for fun abstract art, Tableau can be the platform to turn data into something extraordinary. So go ahead—open up a blank workbook, let go of the rules, and see where your creativity takes you.
TLDR
Push your skills, break the rules and bring those creative ideas to life. Create for fun for the ultimate viz satisfaction.
Thanks for reading as always, get in touch or like if you appreciate my sentiment.
Have fun
Adam
First published on the original coffeetableviz WordPress site.