Sport
The grid is a guide, not a verdict
Max Verstappen, eleven seasons, and the rather interesting difference between where you start and where you finish.
Max Verstappen, eleven seasons, and the rather interesting difference between where you start and where you finish.
In São Paulo in 2024, Max Verstappen started 17th and won the Grand Prix.
Not exactly the shortest route to the podium.
It’s also the sort of result that makes you wonder whether starting position tells us quite as much as we think.
For the Shorts in Sports community project, I picked up a dataset shared by The Data Taylor, covering Verstappen’s Formula 1 career from 2015 onwards.
There are plenty of ways to measure a successful racing driver. Wins, points, championships, trophies cluttering the mantelpiece.
I wanted to look at something slightly different.
Where did he start, and where did he end up?
Three charts, eleven completed seasons, and a few rather eventful Sundays.
1. Winning became something of a habit
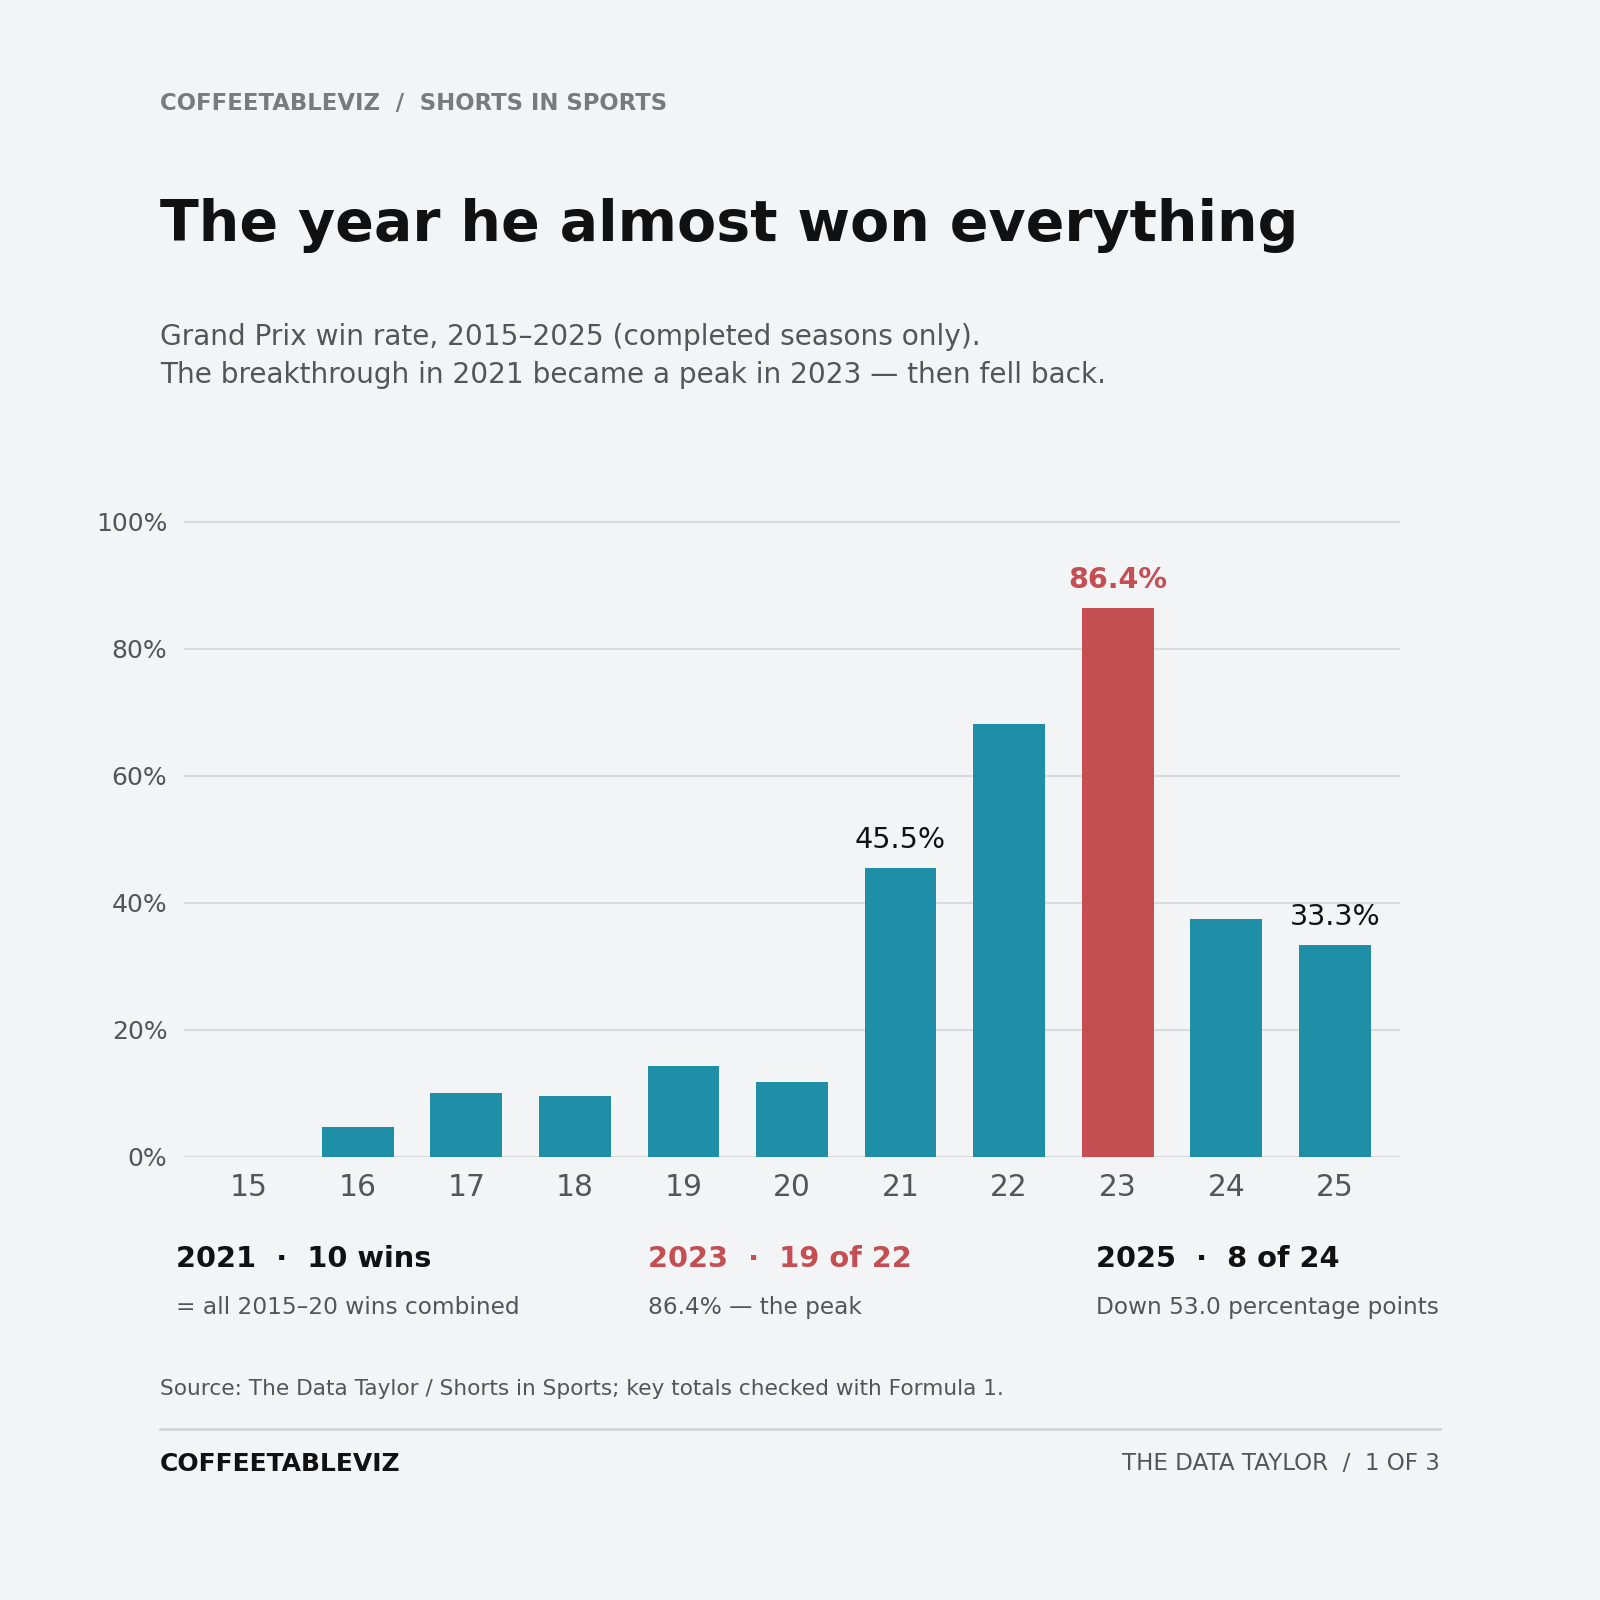
The early years are relatively modest. Then things get interesting.
In 2021, Verstappen won 10 Grands Prix. That’s as many as he’d won across the previous six seasons combined.
And then came 2023.
19 wins from 22 races. An 86.4% win rate.
Even the chart looks slightly surprised.
By 2025, that had fallen to eight wins from 24 races. Still impressive, but a reminder that dominance in Formula 1 doesn’t come with a lifetime guarantee.
Of course, winning depends on rather more than the person holding the steering wheel. The car helps. Quite a lot, actually.
But wins only tell us how the race ended.
What about where it began?
2. Starting at the front helps. Usually.
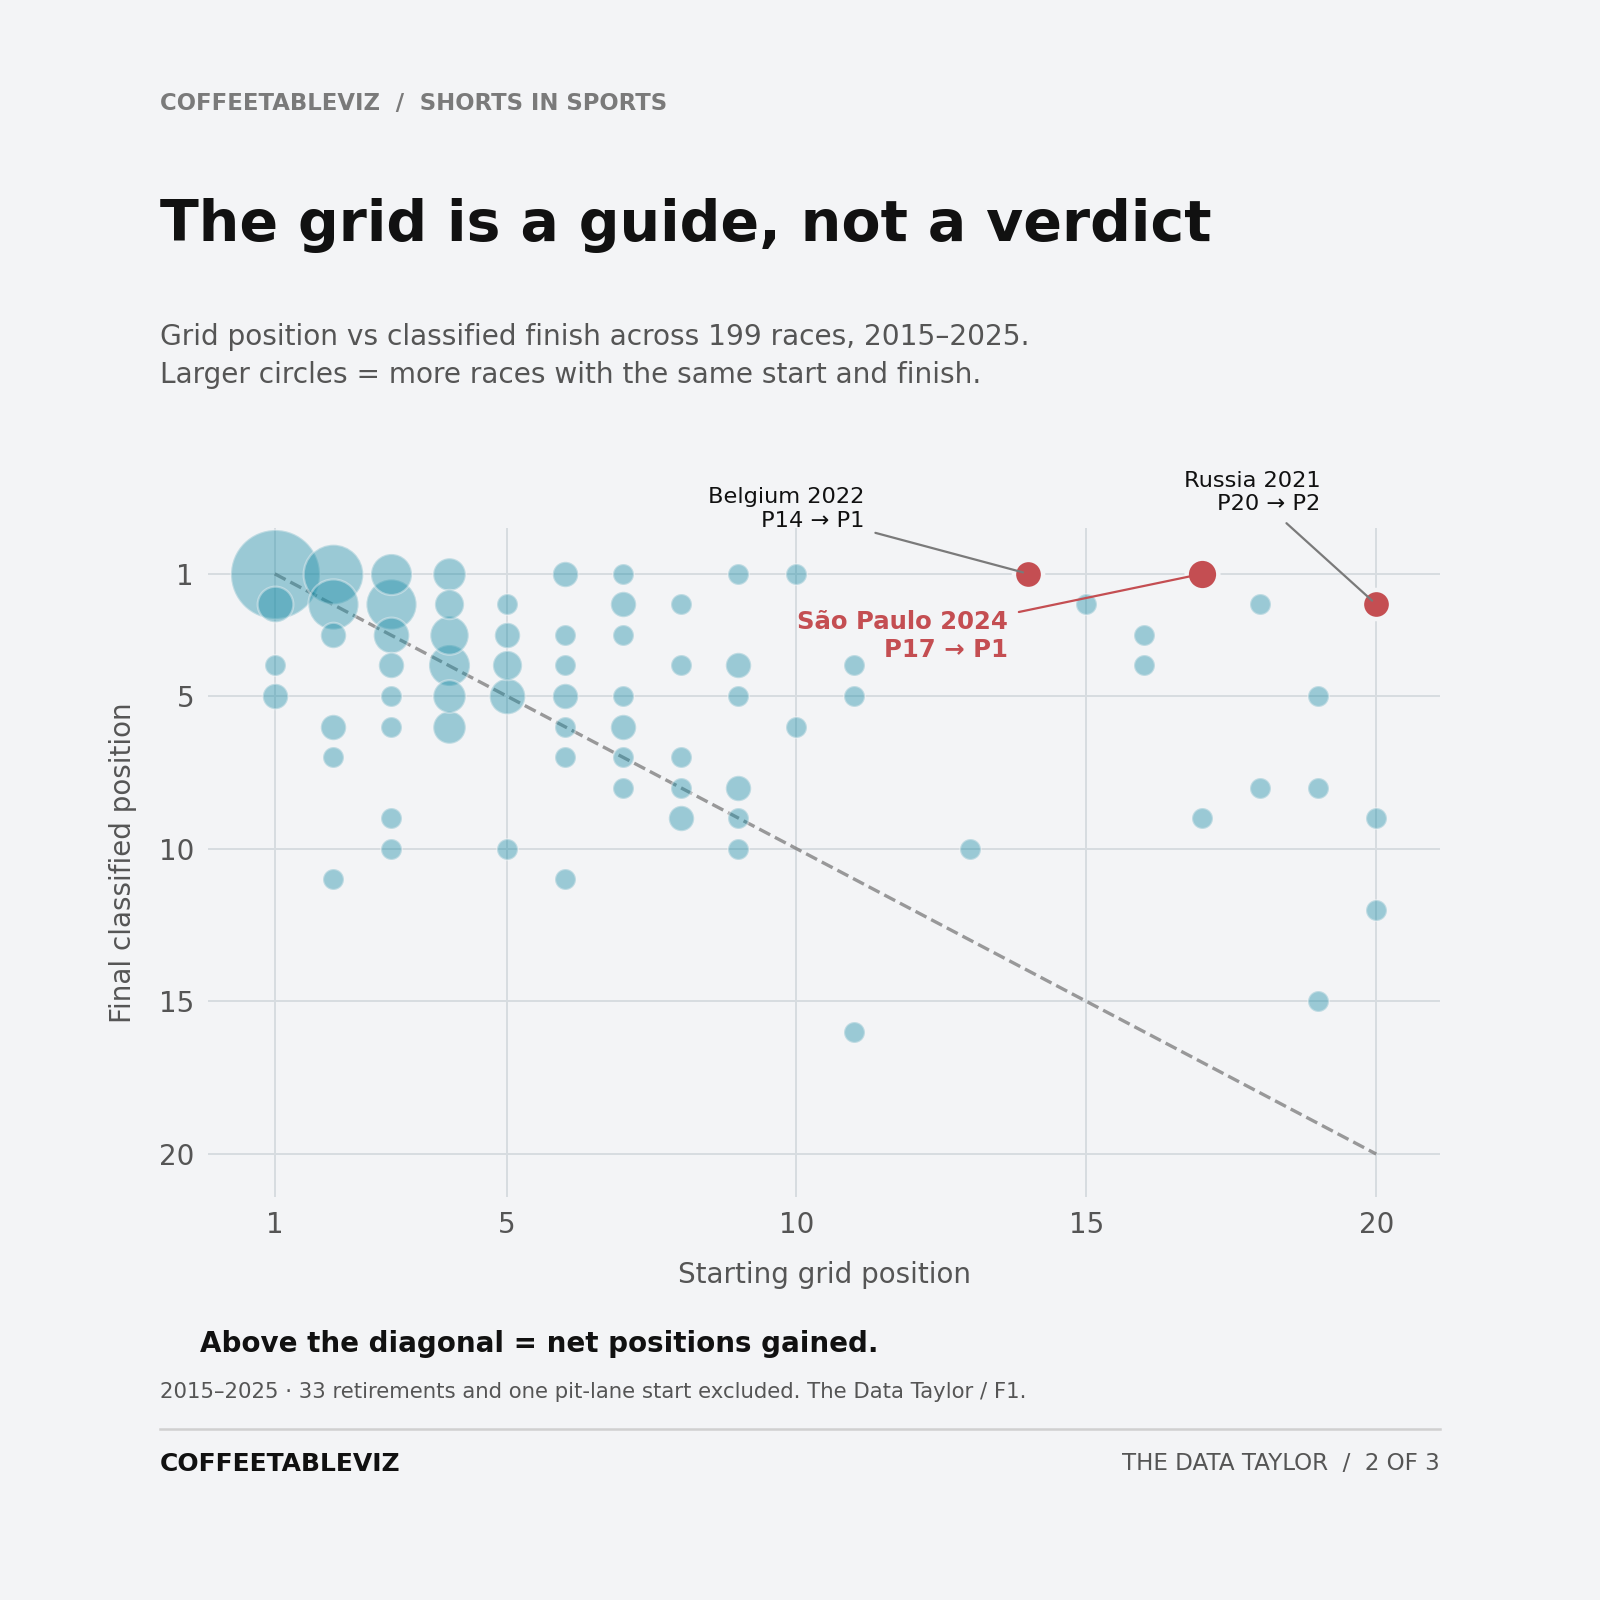
Here’s every eligible classified race result from 2015 to 2025, comparing Verstappen’s starting position with his finishing position.
The bigger circles show combinations that happened more frequently.
Unsurprisingly, there’s plenty of activity near the front. Starting near pole position tends to be rather useful.
But look away from that cluster.
Some of the more interesting dots represent races where Verstappen started well down the grid and finished somewhere considerably more respectable.
Those are the ones that caught my eye.
Because a victory from pole is one story.
A victory from 17th is quite another.
3. The long way to the podium
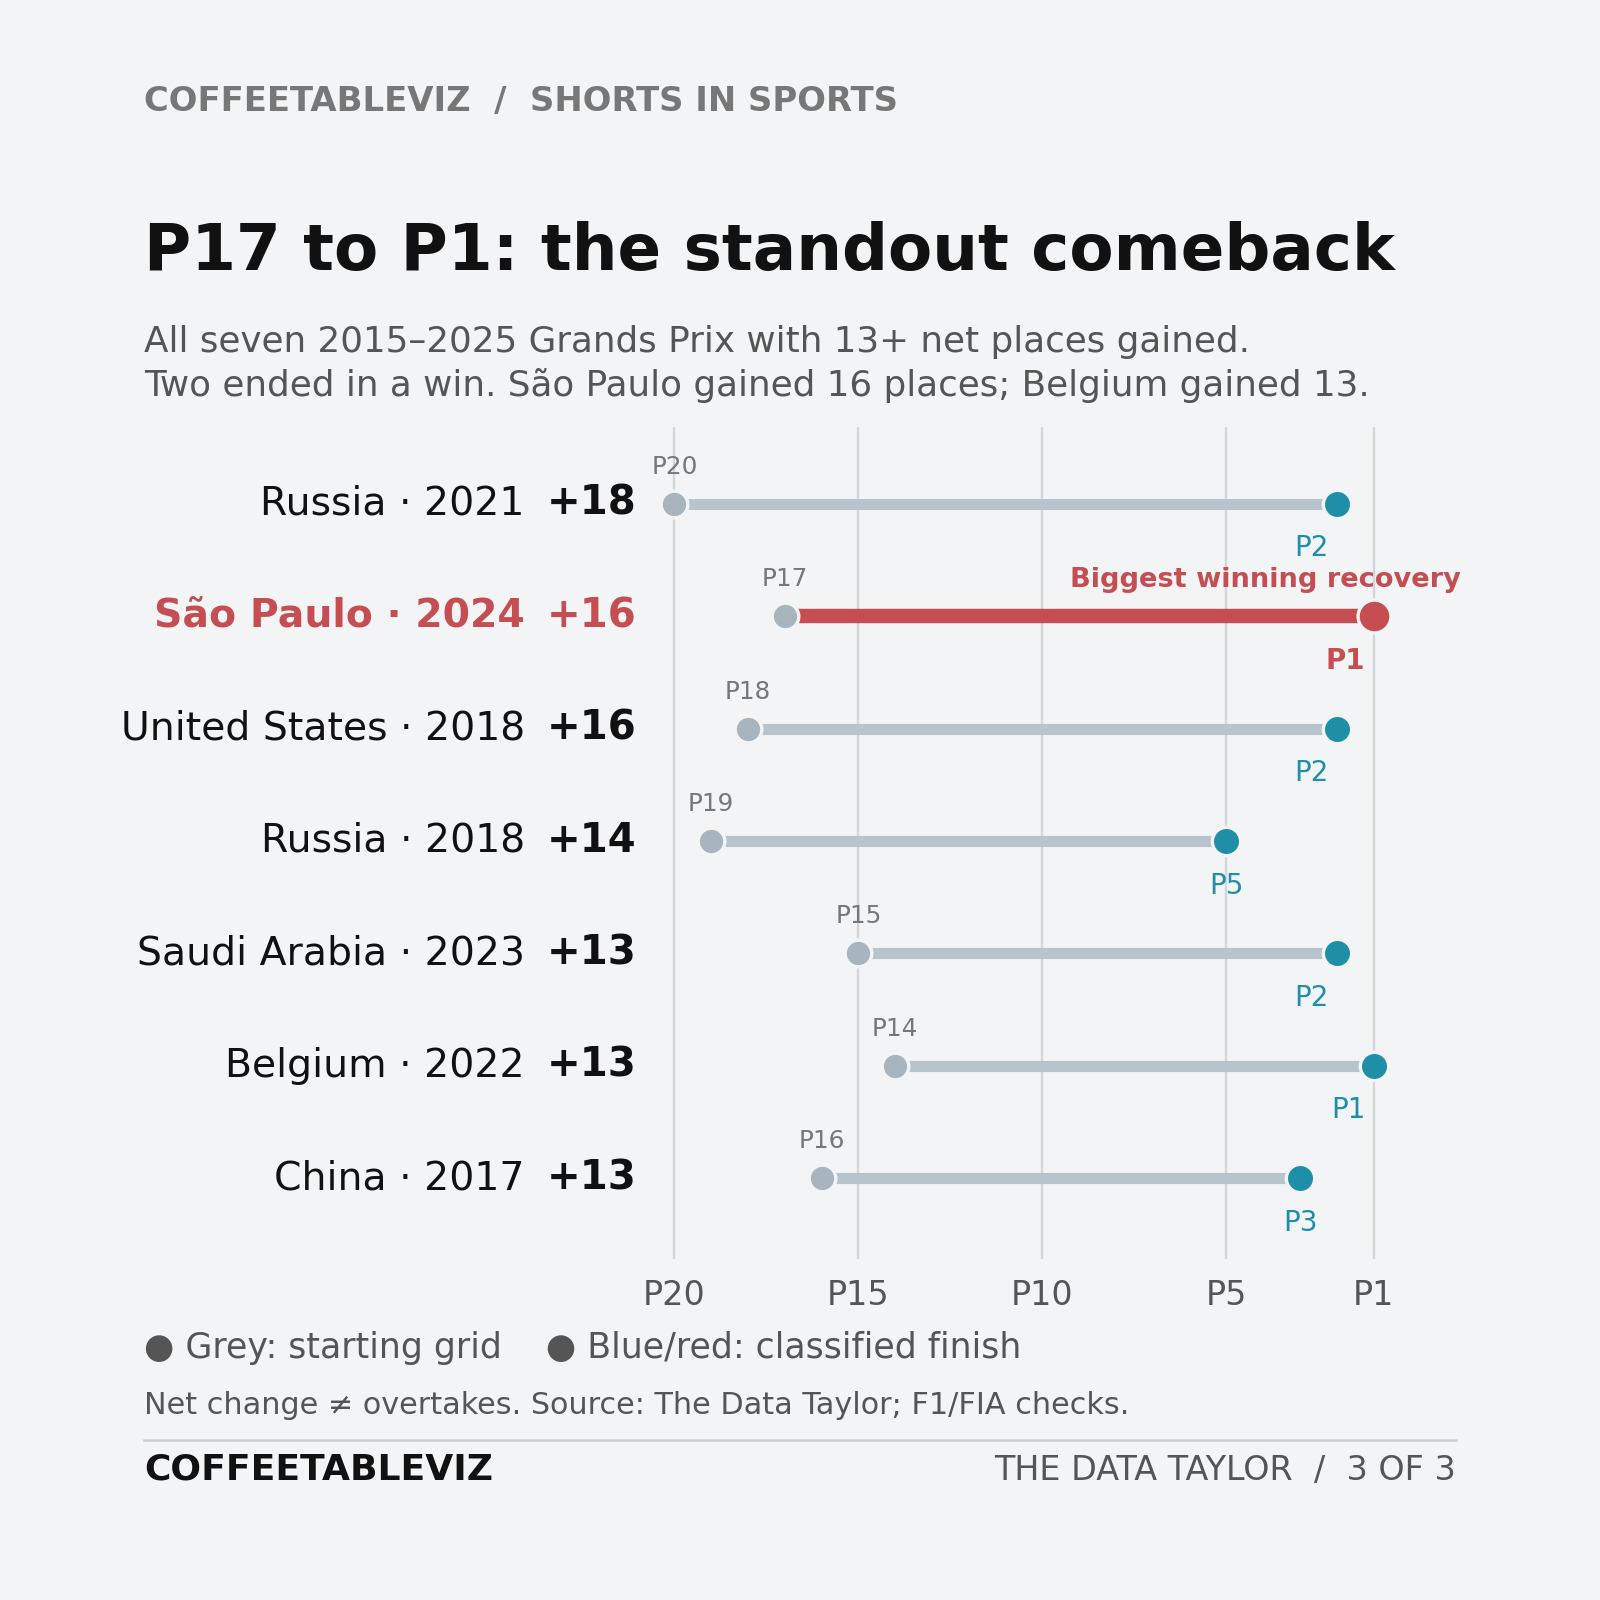
This is my favourite of the three.
It shows all seven races in the dataset where Verstappen gained at least 13 positions between the starting grid and the classified finish.
The biggest improvement came at the 2021 Russian Grand Prix, climbing from 20th to second. Eighteen places gained.
Not a bad afternoon.
But it’s São Paulo 2024 that gets the red highlight.
Starting 17th, Verstappen worked his way through a rain-soaked race to finish first. A 16-place improvement and a victory to go with it. (FIA race report)
Belgium 2022 deserves a mention too: 14th to first. Apparently starting towards the back doesn’t always ruin the weekend.
There’s a distinction worth making here. These are net positions gained, not counts of overtakes. Retirements, strategy, penalties and a fair bit of racing chaos can all change the finishing order.
Still, the difference between the two endpoints makes for quite a story.
And what about 2026?
You might notice that 2026 is missing from the charts.
That’s deliberate. The season isn’t finished, and I wanted to compare complete years rather than mix a partial season into the story.
But it’s already offered a few talking points.
At the Australian Grand Prix, Verstappen started 20th and finished sixth — another 14-place recovery. The source data also records two victories through the Singapore Grand Prix in October. (Formula 1 Australian GP starting grid and classification)
There’s clearly more to explore. We’ll give 2026 its own look when the final chequered flag has fallen.
So, what did we learn?
Well, starting at the front is still a good idea.
No great revelation there.
But looking only at victories misses some of the most entertaining performances. And looking only at finishing position misses the journey altogether.
Sometimes two fairly ordinary numbers — starting position and finishing position — tell a much better story when you put them together.
Especially when there’s a rather large gap between them.
The interesting bit isn’t always where somebody finishes. Sometimes it’s how far they’ve travelled to get there.
And occasionally, that journey involves starting 17th in the rain.
A note on the numbers
The three charts cover Verstappen’s completed Grand Prix seasons from 2015 to 2025, using data shared by The Data Taylor. Sprint races are not included.
For the start-versus-finish analysis, retirements and the 2025 São Paulo pit-lane start are excluded to keep comparisons consistent. The original source data remains unchanged. (Formula 1’s 2025 São Paulo report)
The key comeback results have been cross-checked against official Formula 1 and FIA records. The chart showing position changes represents movements in the final classification, not individual overtakes. Methodology and derived data.
Data: The Data Taylor — Shorts in Sports
Analysis and visualisation: coffeetableviz
More charts, stories and occasional numerical distractions at coffeetableviz.com.