Sport
Can you find the four outsiders?
Six straight Japanese wins in Berlin. Then just four winners from outside Kenya and Ethiopia across six major marathons in the 2010s. Where did the red dots go?
Berlin, 2005. Mizuki Noguchi wins the women’s marathon. That’s six straight victories for Japan in this race, dating back to 2000. Six years, six Japanese champions. And a rather different picture from the one we associate with marathon running today.
The world still won
Look across six big-city marathons in the 2000s. Every dot is a women’s race winner, with a two-letter country code inside. Grey is Kenya or Ethiopia. Red means somewhere else.
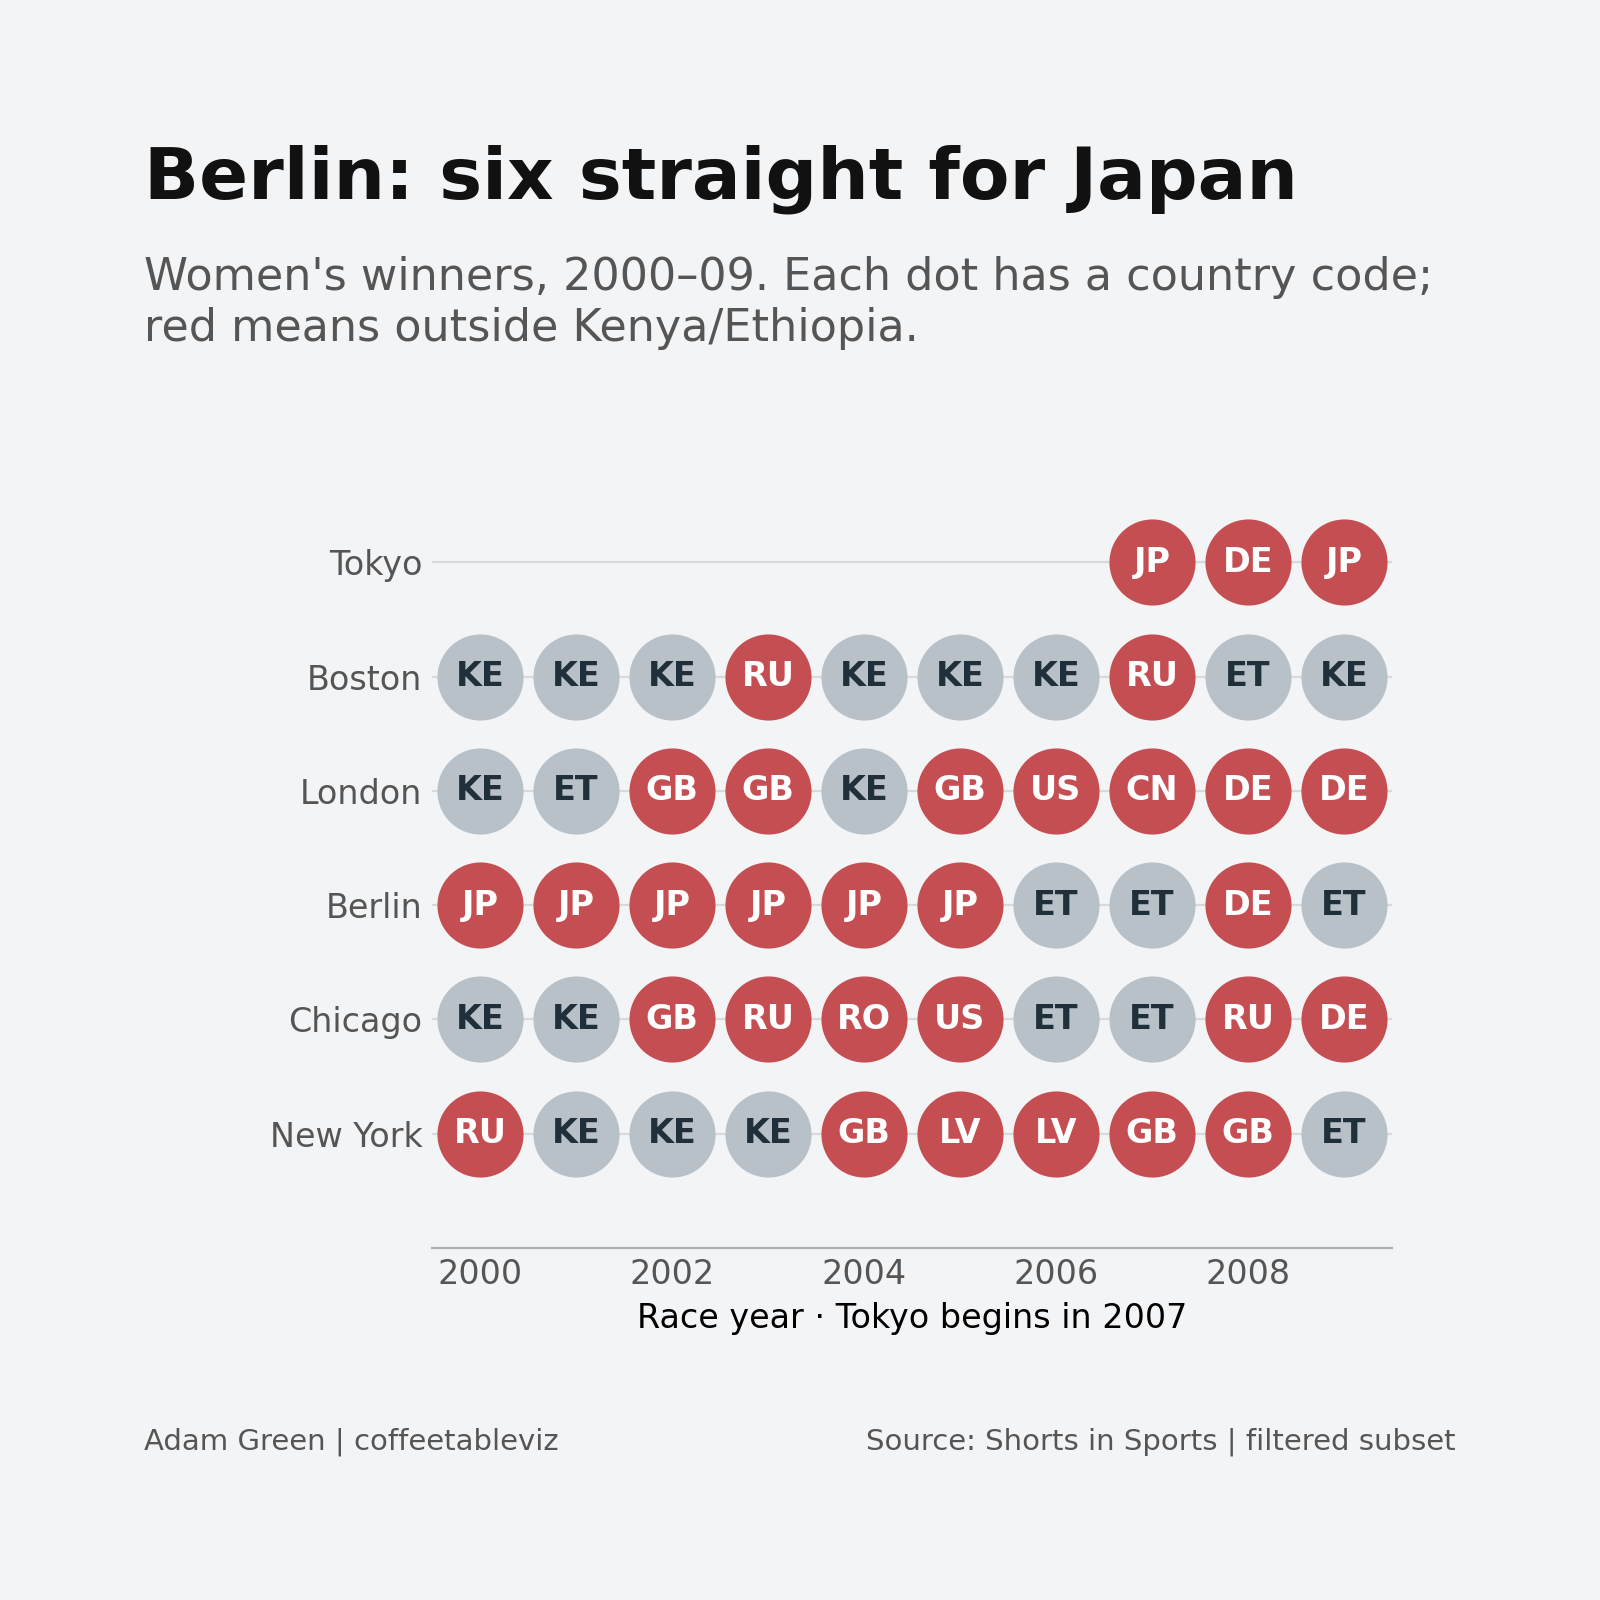
There’s plenty of red. 31 of 53 victories went to other countries, including eight for Japan and seven for the United Kingdom. Berlin’s first six dots are all JP. Quite a run, literally.
But take the same races and move the calendar forward ten years.
Now find the four
Same six race rows. Same colours, same country codes. One dot for every completed race. How many red dots can you spot?
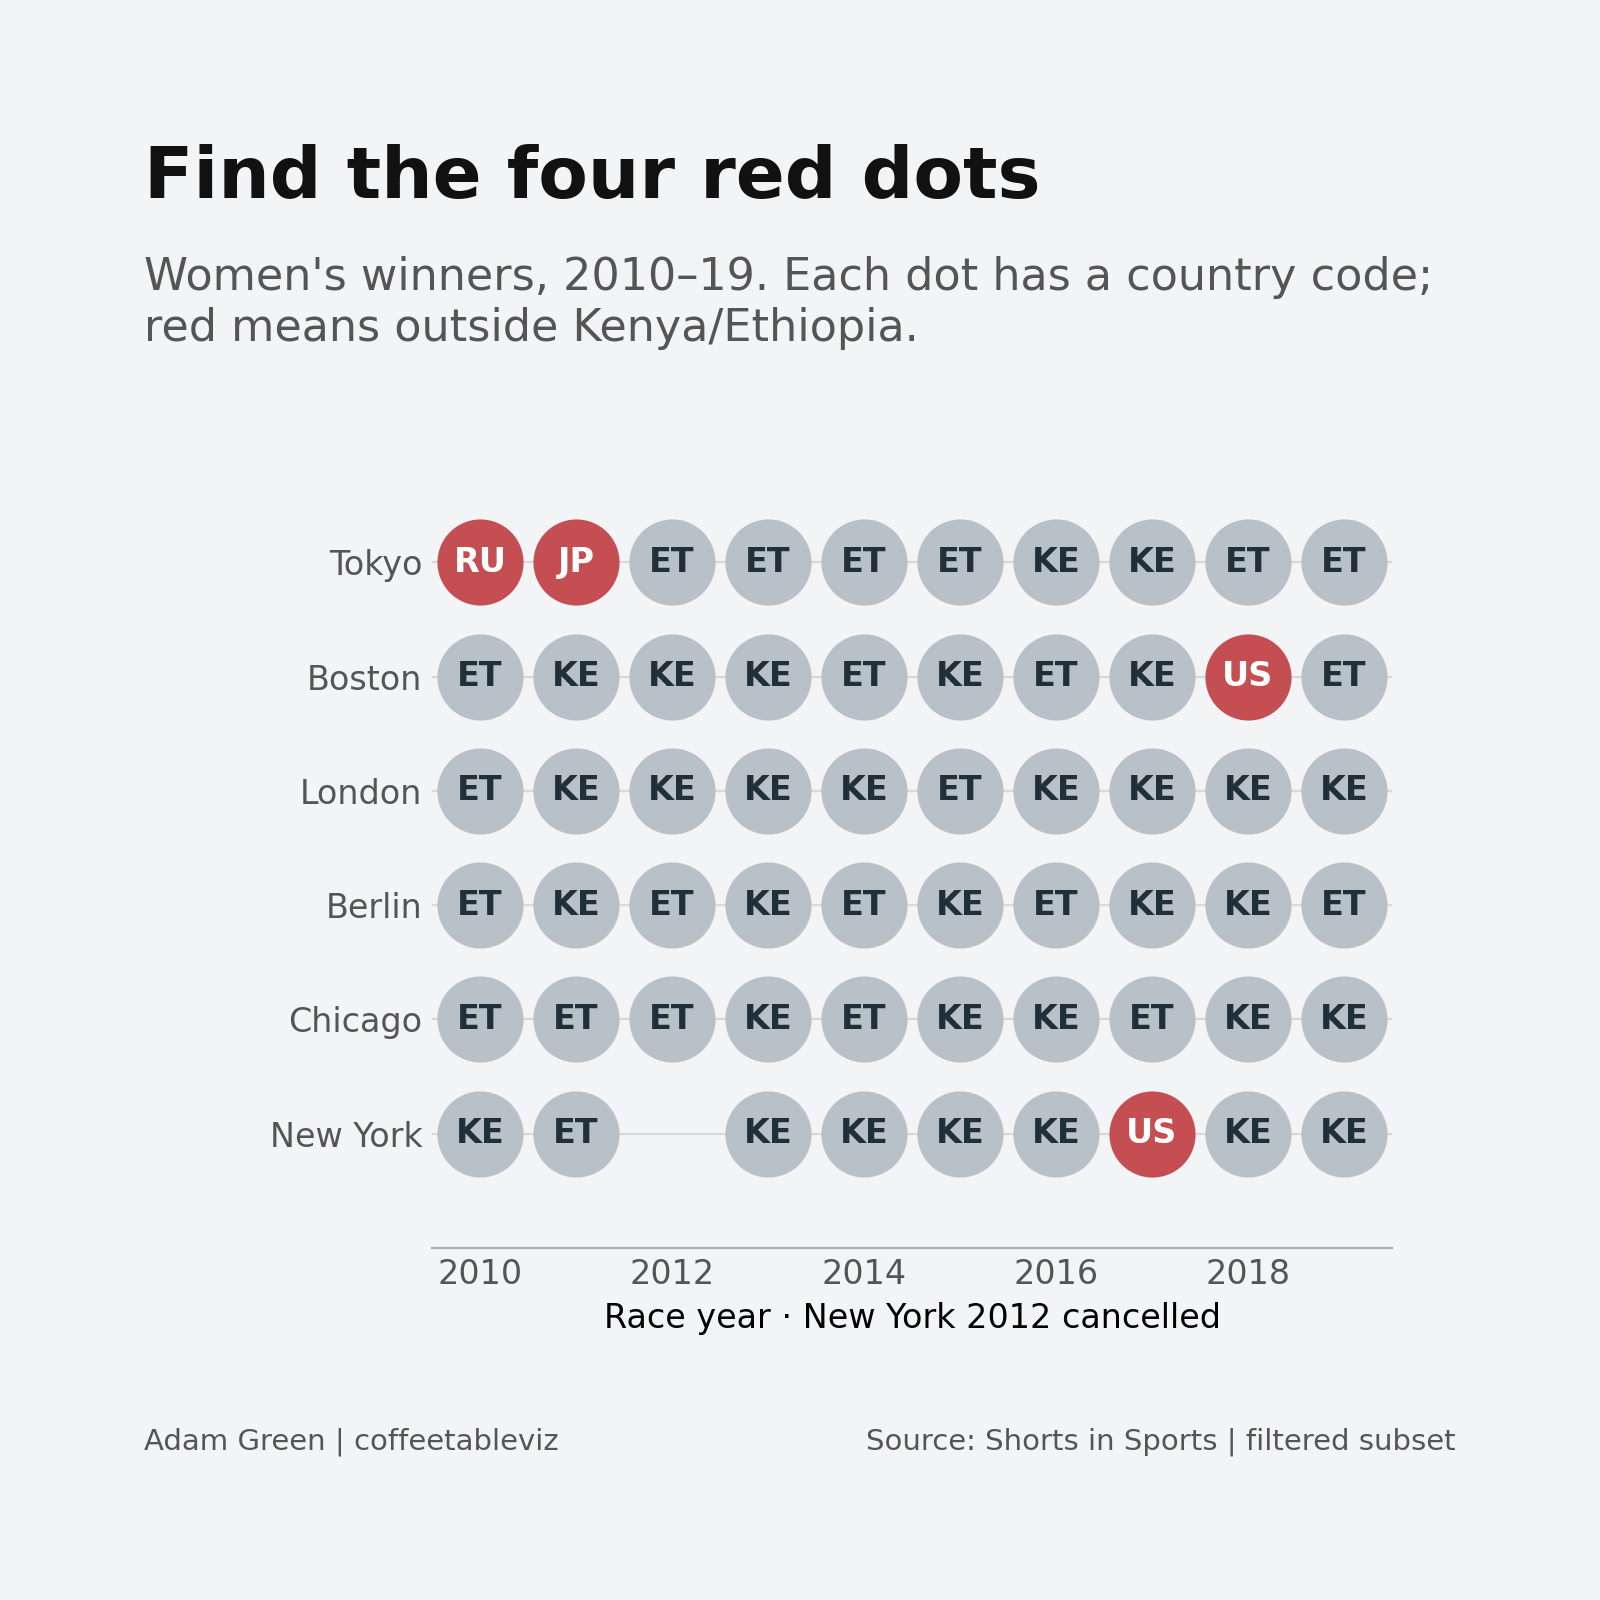
Four. Out of 59. Two at Tokyo — Alevtina Biktimirova (Russia, 2010) and Noriko Higuchi (Japan, 2011) — then Shalane Flanagan (New York, 2017) and Desiree Linden (Boston, 2018), both from the US.
Higuchi was awarded the 2011 title after the original winner’s disqualification. And that blank New York spot in 2012? Hurricane Sandy cancelled the race. Neither is a missing value dressed up as a result.
The bigger shift wasn’t the men’s
The next chart steps back to compare men and women across the two decades. The measure is the share of wins outside Kenya and Ethiopia — not the share of runners taking part.
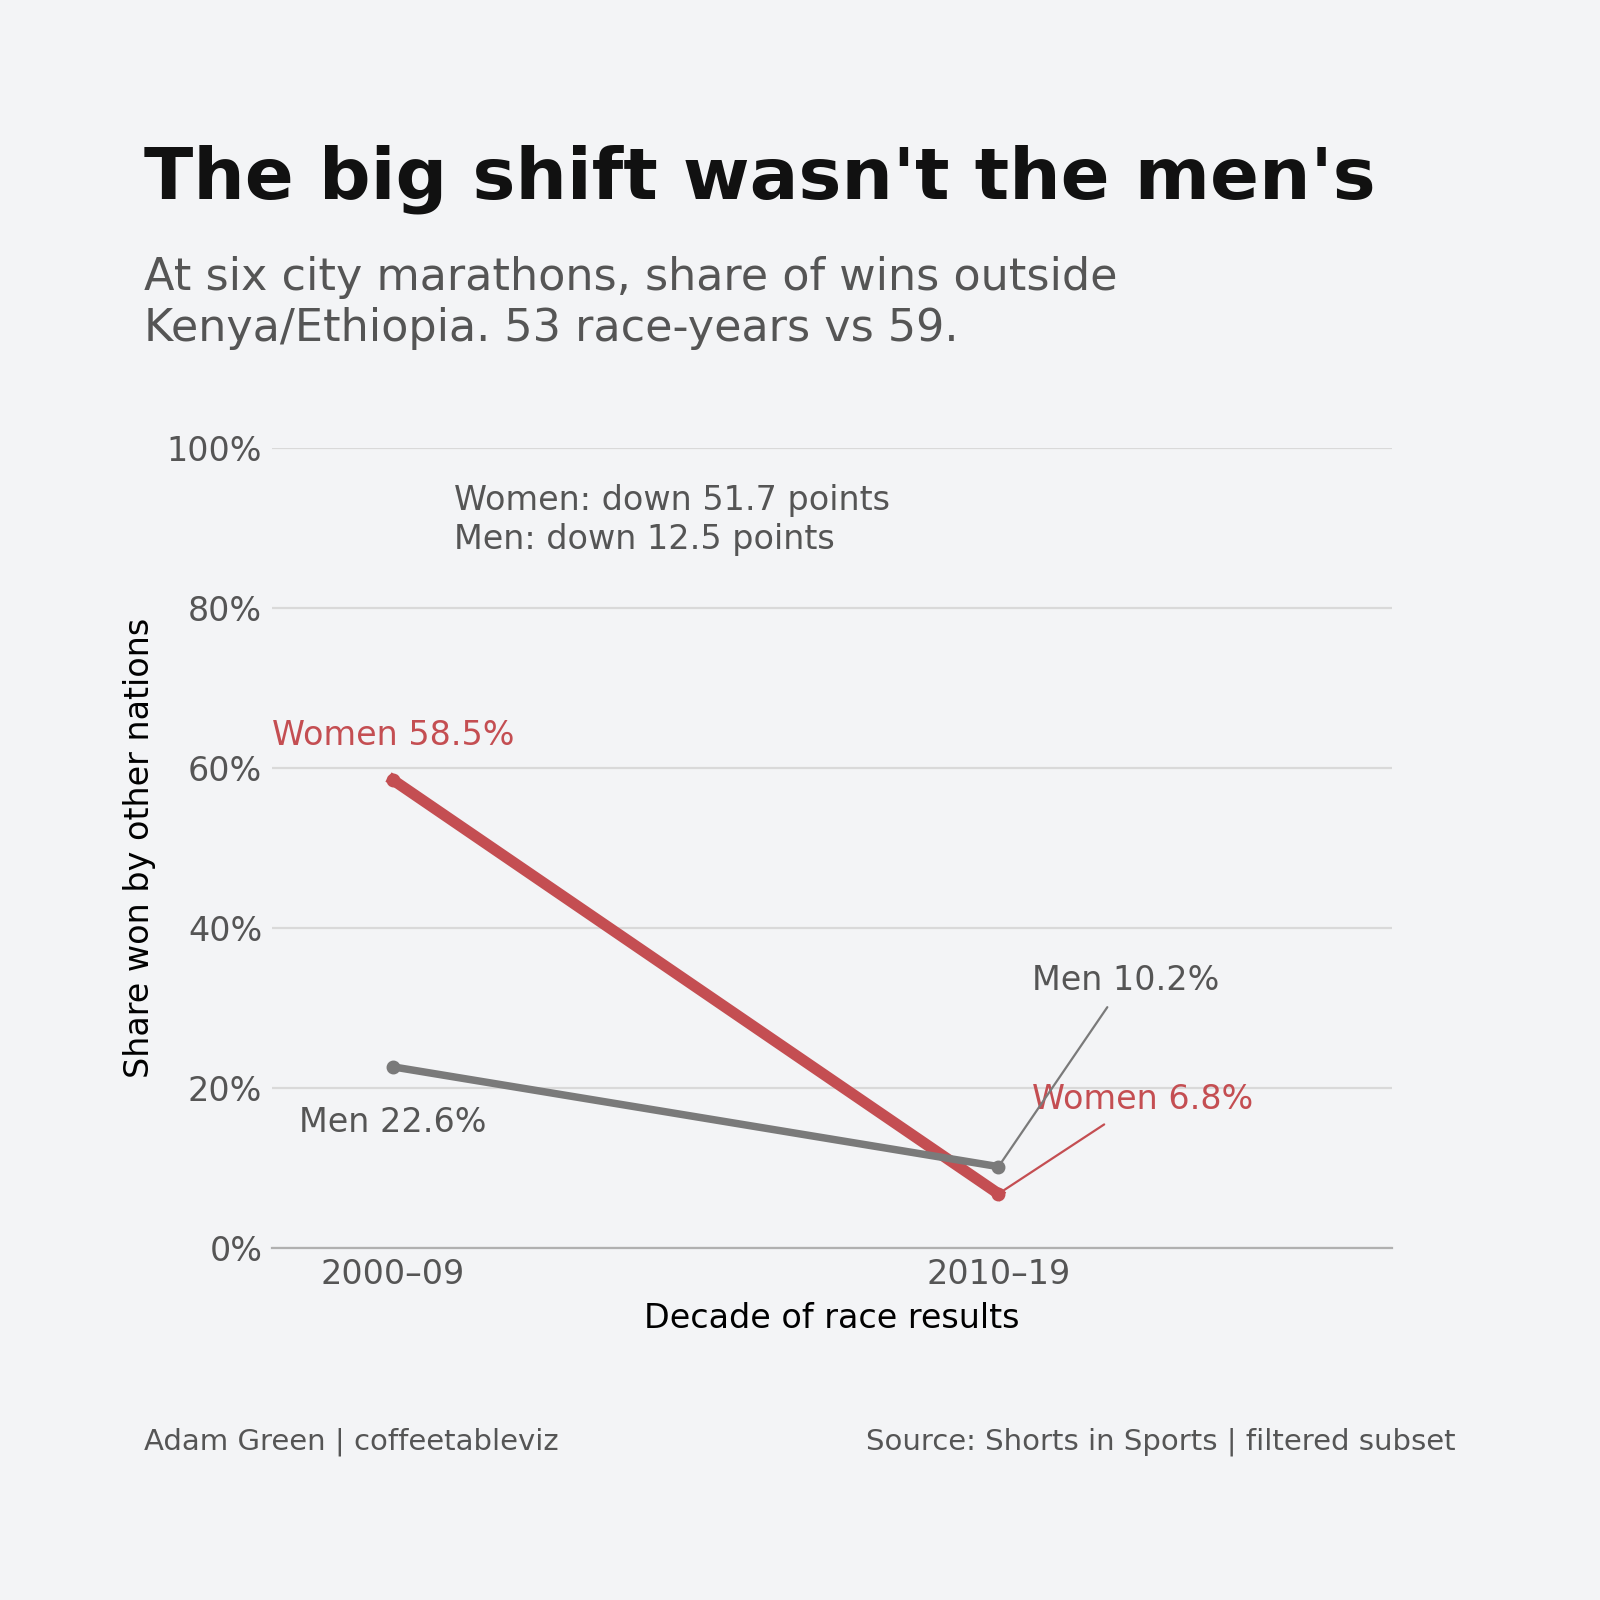
For women, that share fell from 58.5% to 6.8%. A drop of 51.7 percentage points. For men it went from 22.6% to 10.2% — just 12.5 points. Men’s winning nationalities were concentrated already. Women’s changed much more dramatically.
So where did the red go?
The data tells us what happened, not why. But there are a few clues. Historian Michelle Sikes describes how Kenyan women gained more access to professional racing after facing barriers that men didn’t face to the same degree.
Then there’s the depth of competition. World Athletics counted 18 Ethiopian women under 2:26 for a marathon in 2010, up from eight the year before. By 2011, Kenyan and Ethiopian women occupied 16 of the world’s top 20 marathon rankings. Meanwhile, Japan was working out how to follow an exceptional generation of champions.
None of that proves what caused these particular results. We’d need starting fields and a lot more besides. But the possibility is intriguing: the winners’ map may have narrowed partly because more women had a route into world-class racing.
TLDR
Six straight Japanese women’s wins at Berlin became just four non-Kenyan/non-Ethiopian women’s wins across six big-city marathons in the 2010s. The shift was much bigger for women than men. Wider opportunity and a deeper elite field may help explain it, but the charts alone can’t prove why.
A note on the numbers
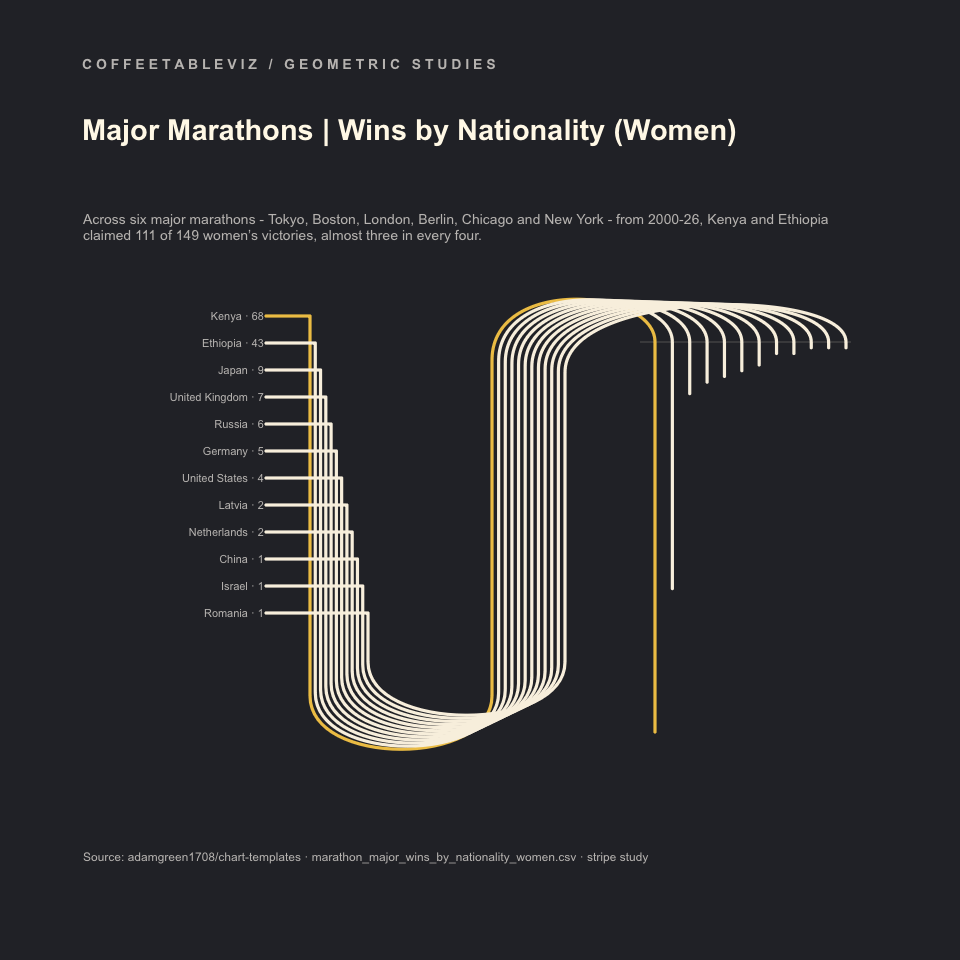
The Bauhaus feature image covers 2000–26: Kenya 68 women’s wins, Ethiopia 43, together 111 of 149 in the source’s six-race nationality summary. The three charts below zoom in on 2000–19 to compare two complete decades; the denominators are different. The artwork is a decorative stripe study, not a scaled bar chart.
The three charts use the pinned Shorts in Sports winners dataset for six historical major races, not all today’s World Marathon Majors. The comparison covers 53 completed race-years in 2000–09 and 59 in 2010–19. Tokyo enters in 2007; cancelled New York 2012 is excluded. Country codes are ISO 3166-1 alpha-2, so the UK is GB.
The GitHub data QA checks the records and calculations and verifies explicitly flagged results. It is not a complete official-results audit: 216 completed source entries remain labelled Not independently checked. This is a story about winning nationalities in the supplied races, not all competitors or the causes of success.
Data: Shorts in Sports
Analysis and visualisation: coffeetableviz
simple charts clear stories.