Economy
How is war shaping fuel prices
This analysis was created using a simple (but I think fairly 💪) workflow, all authored on my 📱 sat on my sofa geeking out on a Friday night when I should have been doing what most people do 📺🍷.
A Friday night 🐇 🕳️ ➡️🧠🐾 inspired by visual on Voronoi – Gasoline price changes
where interest, tech learning collide.
In late February 2026, a geopolitical shock hit global energy markets.
The escalation of the US–Iran conflict disrupted one of the world’s most critical oil arteries — the Strait of Hormuz — sending fuel prices sharply ⬆️ across the globe.
But it doesn’t look like the 😲 has landed evenly.
Some countries saw modest increases. Others experienced extreme spikes. And a few have barely moved at all.
Below isn’t just a story about rising prices, It’s a story about how the global shock wave travelled and where it had been felt most.
How a war is reshaping fuel prices worldwide
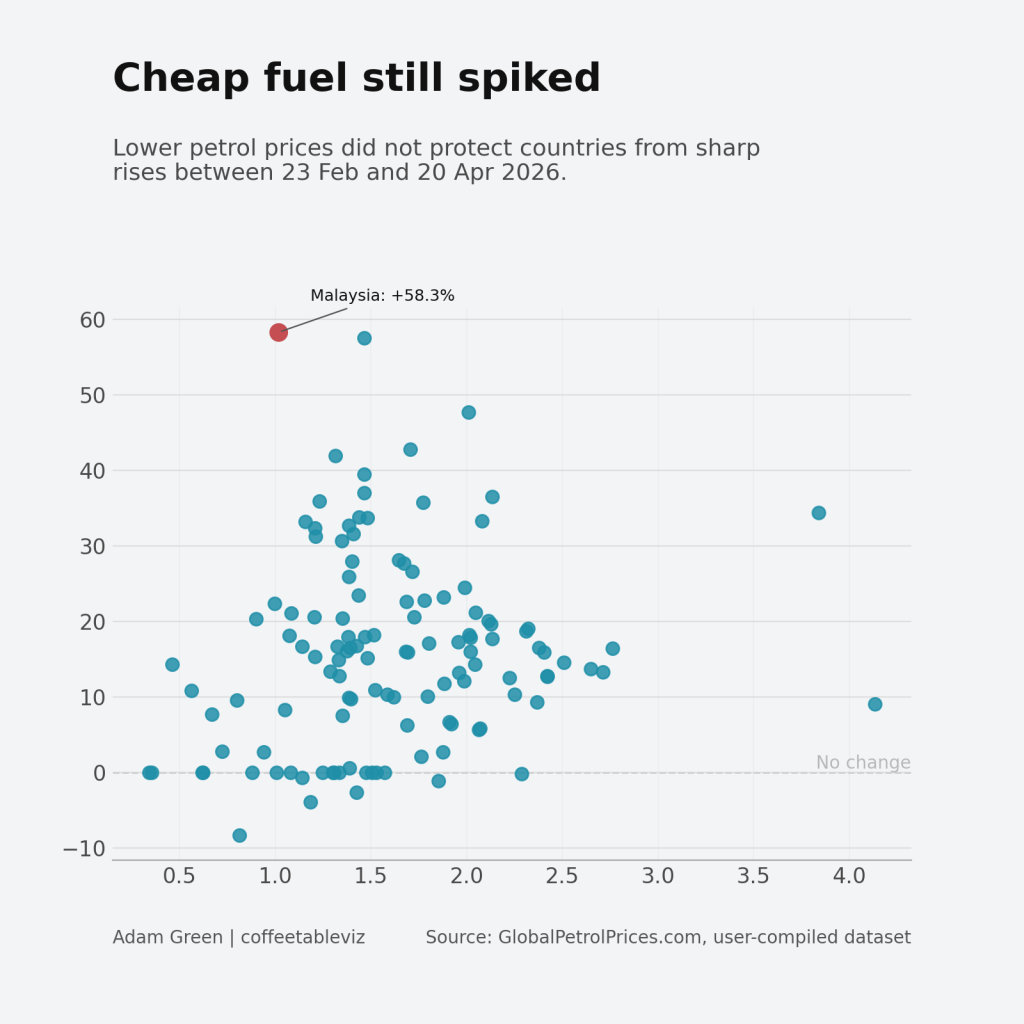
If global shocks were simple, you’d expect the most expensive countries to be hit hardest.
But that’s not what happened, Countries with relatively cheap petrol still saw some of the largest percentage increases. Malaysia is a clear example of lower starting prices, but a sharp percentage spike.
Cheap fuel didn’t provide protection. It often came with volatility.
The shock is hitting the real economy through diesel
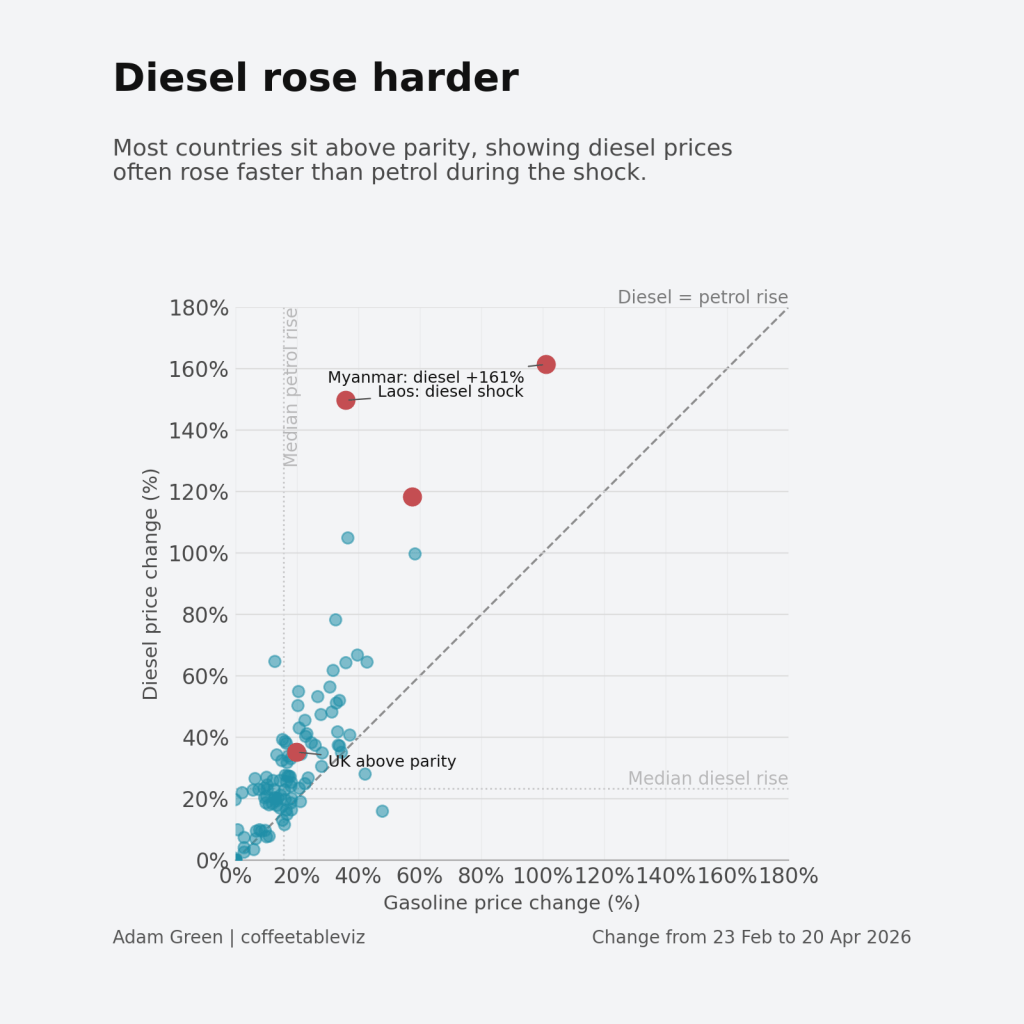
The second shift is where the story becomes more serious. In many countries, diesel rose faster than petrol.
That matters because diesel isn’t just another fuel. It powers freight, logistics, agriculture and industry. When diesel prices rise faster, the impact spreads far beyond the pump.
This is how a geopolitical shock becomes an economic one.
Policy may be deciding who feels the shock
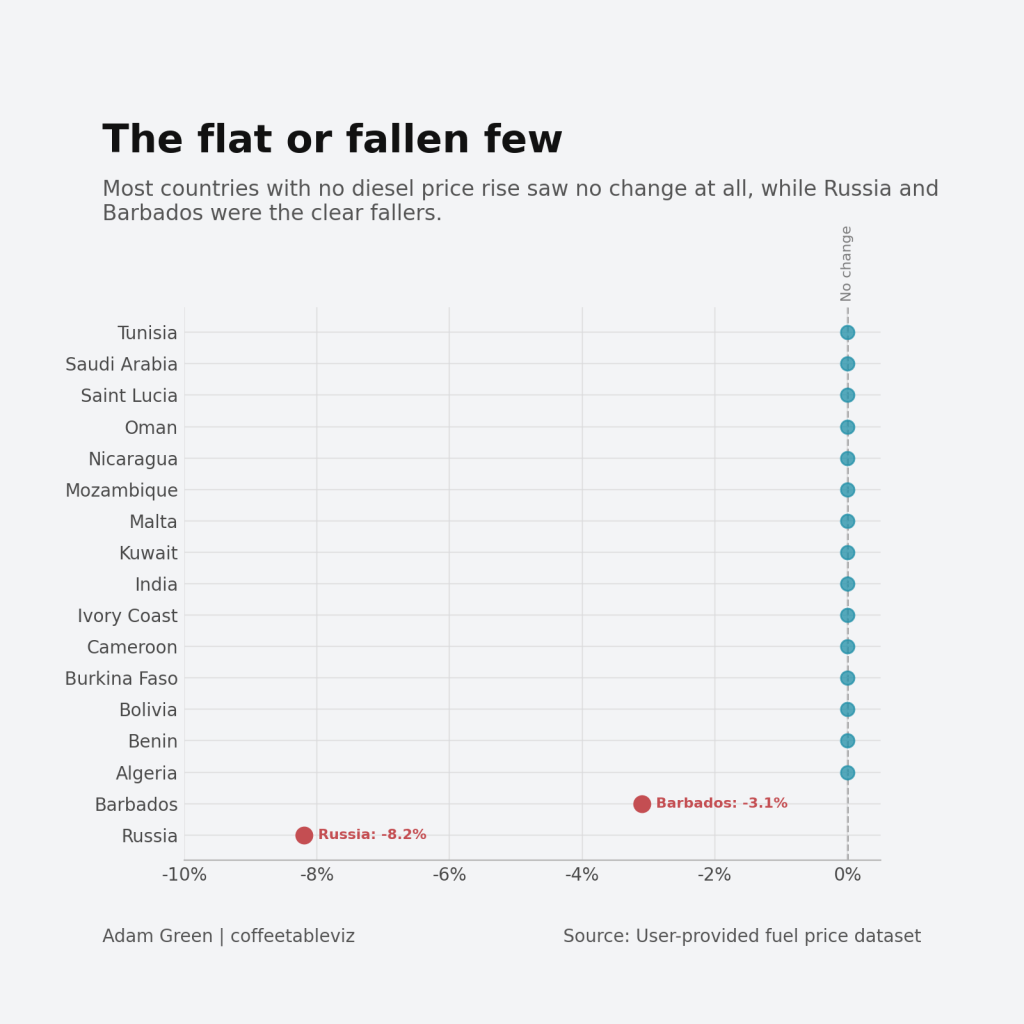
While many countries saw sharp increases in both gasoline (Petrol) and/or Diesel, others barely moved at all.
Here pokes 👉🏻 at not just a market story but a policy story.
Subsidies, price controls and government intervention insulate some countries from the global shock 😱, while others absorbed it almost immediately 😭.
What has this meant for the UK?
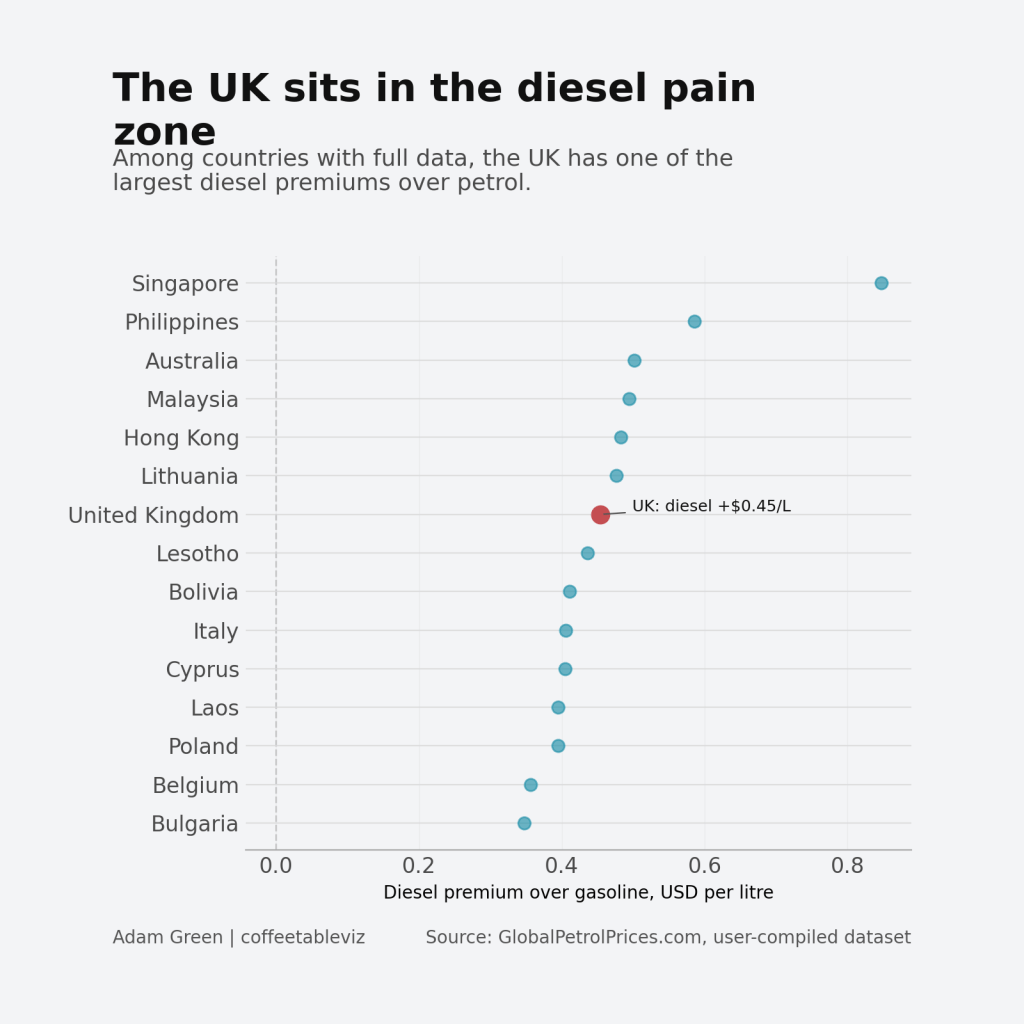
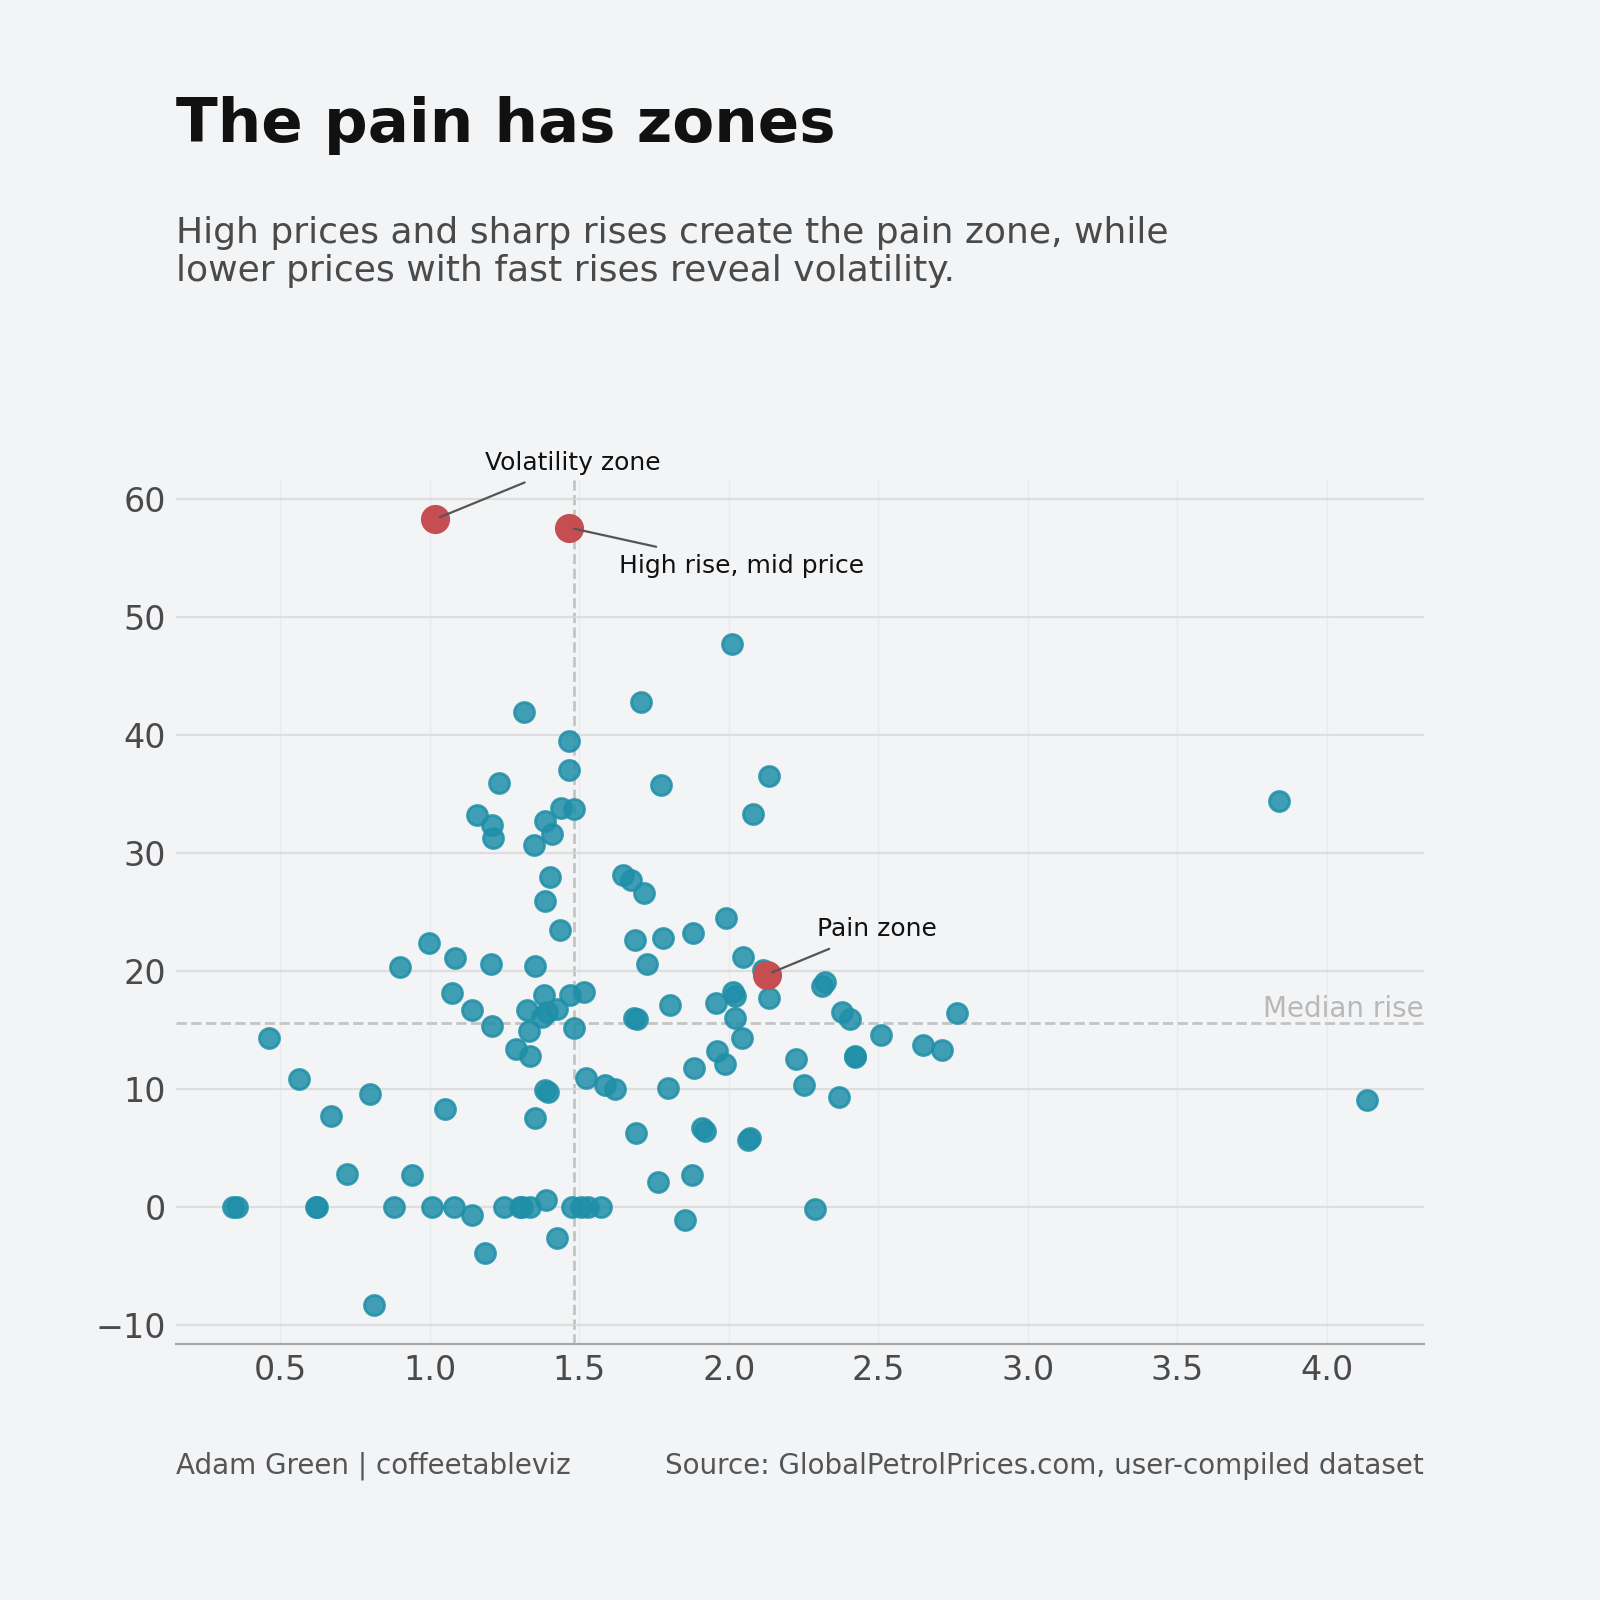
The UK doesn’t sit at the extreme edge of global fuel prices — but it does sit firmly in the diesel pain zone.
With diesel around $0.45 per litre more expensive than petrol, the UK ranks among the countries where the gap is most pronounced.
That matters because diesel is the backbone of logistics. When diesel carries a premium like this, the impact doesn’t stay at the pump — it flows through supply chains, transport costs and ultimately prices.
In other words, the UK isn’t the most extreme case — but it is exposed in the way that matters most economically.
Where has the shock hit hardest?
The story sits in the extremes. Here’s a quick reference of where fuel prices have moved the most and where they barely moved at all.
| Country | Petrol change | Diesel change |
|---|---|---|
| Burma (Myanmar) | +101.1% | +161.4% |
| Philippines | +57.6% | +118.4% |
| Malaysia | +58.3% | +99.7% |
| New Zealand | +36.5% | +105.0% |
| Laos | +35.8% | +149.7% |
| — | ||
| Algeria | 0.0% | 0.0% |
| Saudi Arabia | 0.0% | 0.0% |
| Kuwait | 0.0% | 0.0% |
| Oman | 0.0% | 0.0% |
| Tunisia | 0.0% | 0.0% |
Want the full dataset? Download it here.
UK snapshot
| Metric | Value |
|---|---|
| Petrol price | $2.13 per litre |
| Petrol change | +19.7% |
| Diesel premium | +$0.45 per litre |
| Global rank (diesel gap) | Top 10 |
The takeaway
This wasn’t just a rise in fuel prices.
It was a global shock — filtered through markets, amplified by diesel, and reshaped by policy.
Cheap fuel hasn’t protect countries. Diesel made the shock worse. And policy decides who feels the pain.
How this post and charts were built
This analysis was created using a simple (but I think fairly 💪) workflow, all authored on my 📱 sat on my sofa geeking out on a Friday night when I should have been doing what most people do 📺🍷.
Data was compiled into a clean CSV (copy and paste from globalpetrolprices.com to ChatGPT) enriched with derived metrics, and then passed through a structured ChatGPT prompt to generate chart configurations. These configs were rendered automatically using a Python charting template, with outputs versioned and managed via GitHub Actions.
The result: a faster, repeatable pipeline to get you from data to story by turning raw numbers into fancy pants generated visualisations.
👋
Adam
#coffeetableviz — simple charts, clear stories.
First published on the original coffeetableviz WordPress site.