Design
Tables & Visualisations | A delicate dance in the grand data opera
as the witty saga of data unfolds in the delicate dance between these two contenders. It’s not about choosing sides but recognising that each plays a vital role in the grand data opera
Let’s set the scene
I’ve spent some 20 years in the data visualisation profession and for most of that time I have consciously or subconsciously downplayed the benefits of data tables in favour of the chart. However, during the many conversations and requests over the years, sometimes, our users may just simply want and ultimately need a data table! In this blog I wanted afford a few lines presenting some pros of the humble data table.
The table
The data table, with its neat rows and columns, is the unsung hero of precision. It’s that reliable friend who always has the facts straight, ready to deliver raw data in its unembellished glory. But, let’s be honest, it might not win any awards for flair.
The viz
On the other hand, we have the data visualisation, the graphic virtuoso that turns numbers into a visual symphony. It’s the Picasso of the data world, transforming mundane figures into vibrant charts and graphs that sing stories at a glance. Yet, there’s a risk of it becoming the prima donna, stealing the limelight with its flashy appeal.
Celebrating the Pros
Data tables
Let’s tease out a few Pros for the humble data table
- 1. Precision and Detail: Data tables provide precise numerical values, making them suitable when you need to convey exact data with many decimal places or when the data is highly detailed.
- 2. Data Comparison: Tables allow for easy side-by-side comparison of data points, which can be more effective when you need to analyse differences or relationships between individual values.
- 3. Accessibility: it’s probably fair to say that data tables are more accessible to individuals with visual impairments as they can be read using screen readers, ensuring inclusivity.
- 4. Raw Data: Data tables are ideal for presenting raw data, especially when you want to provide users the ability to do download and manipulate the data themselves or they have an onward use where you cannot facilitate.
Visualisations
While data tables have their place there’s no denying that visualisations are more informative and effective for conveying complex information.
Visualisations have the great ability to provide;
- Enhanced Comprehension: Visualisations simplify complex data by representing it graphically. Charts, graphs, and maps allow viewers to quickly grasp trends, patterns, and outliers that might be buried in a data table.
- Rapid Insight: Visuals offer instant insight. A well-designed chart can reveal relationships and trends at a glance, saving time and effort in data interpretation.
- Memorability: Humans are naturally drawn to visuals. Visualisations make data more memorable, which aids in retaining and recalling information.
- Storytelling: Visualisations enable storytelling with data. By presenting information visually, you can create a narrative that guides the audience through the data, making it more engaging and persuasive.
- Detecting Anomalies: Visualisations make anomalies and outliers more apparent. In a table, these may go unnoticed, but in a graph, they often stand out.
- Comparative Analysis: Visualisations allow for easy comparisons between data points. Whether it’s comparing trends over time, geographic regions, or products, visualisations help out.
- Engagement: When data is presented visually they become more engaging. Whether it’s a business report, scientific paper, or educational material, visualisations connect better emotionally and done right, can add life and vibrancy.
The 🤔
The choice between the two often depends on the action you want to take. Need a detailed breakdown? The data table is your loyal scribe. Craving an instant “aha” moment? Let the data visualisation take center stage.
An Example
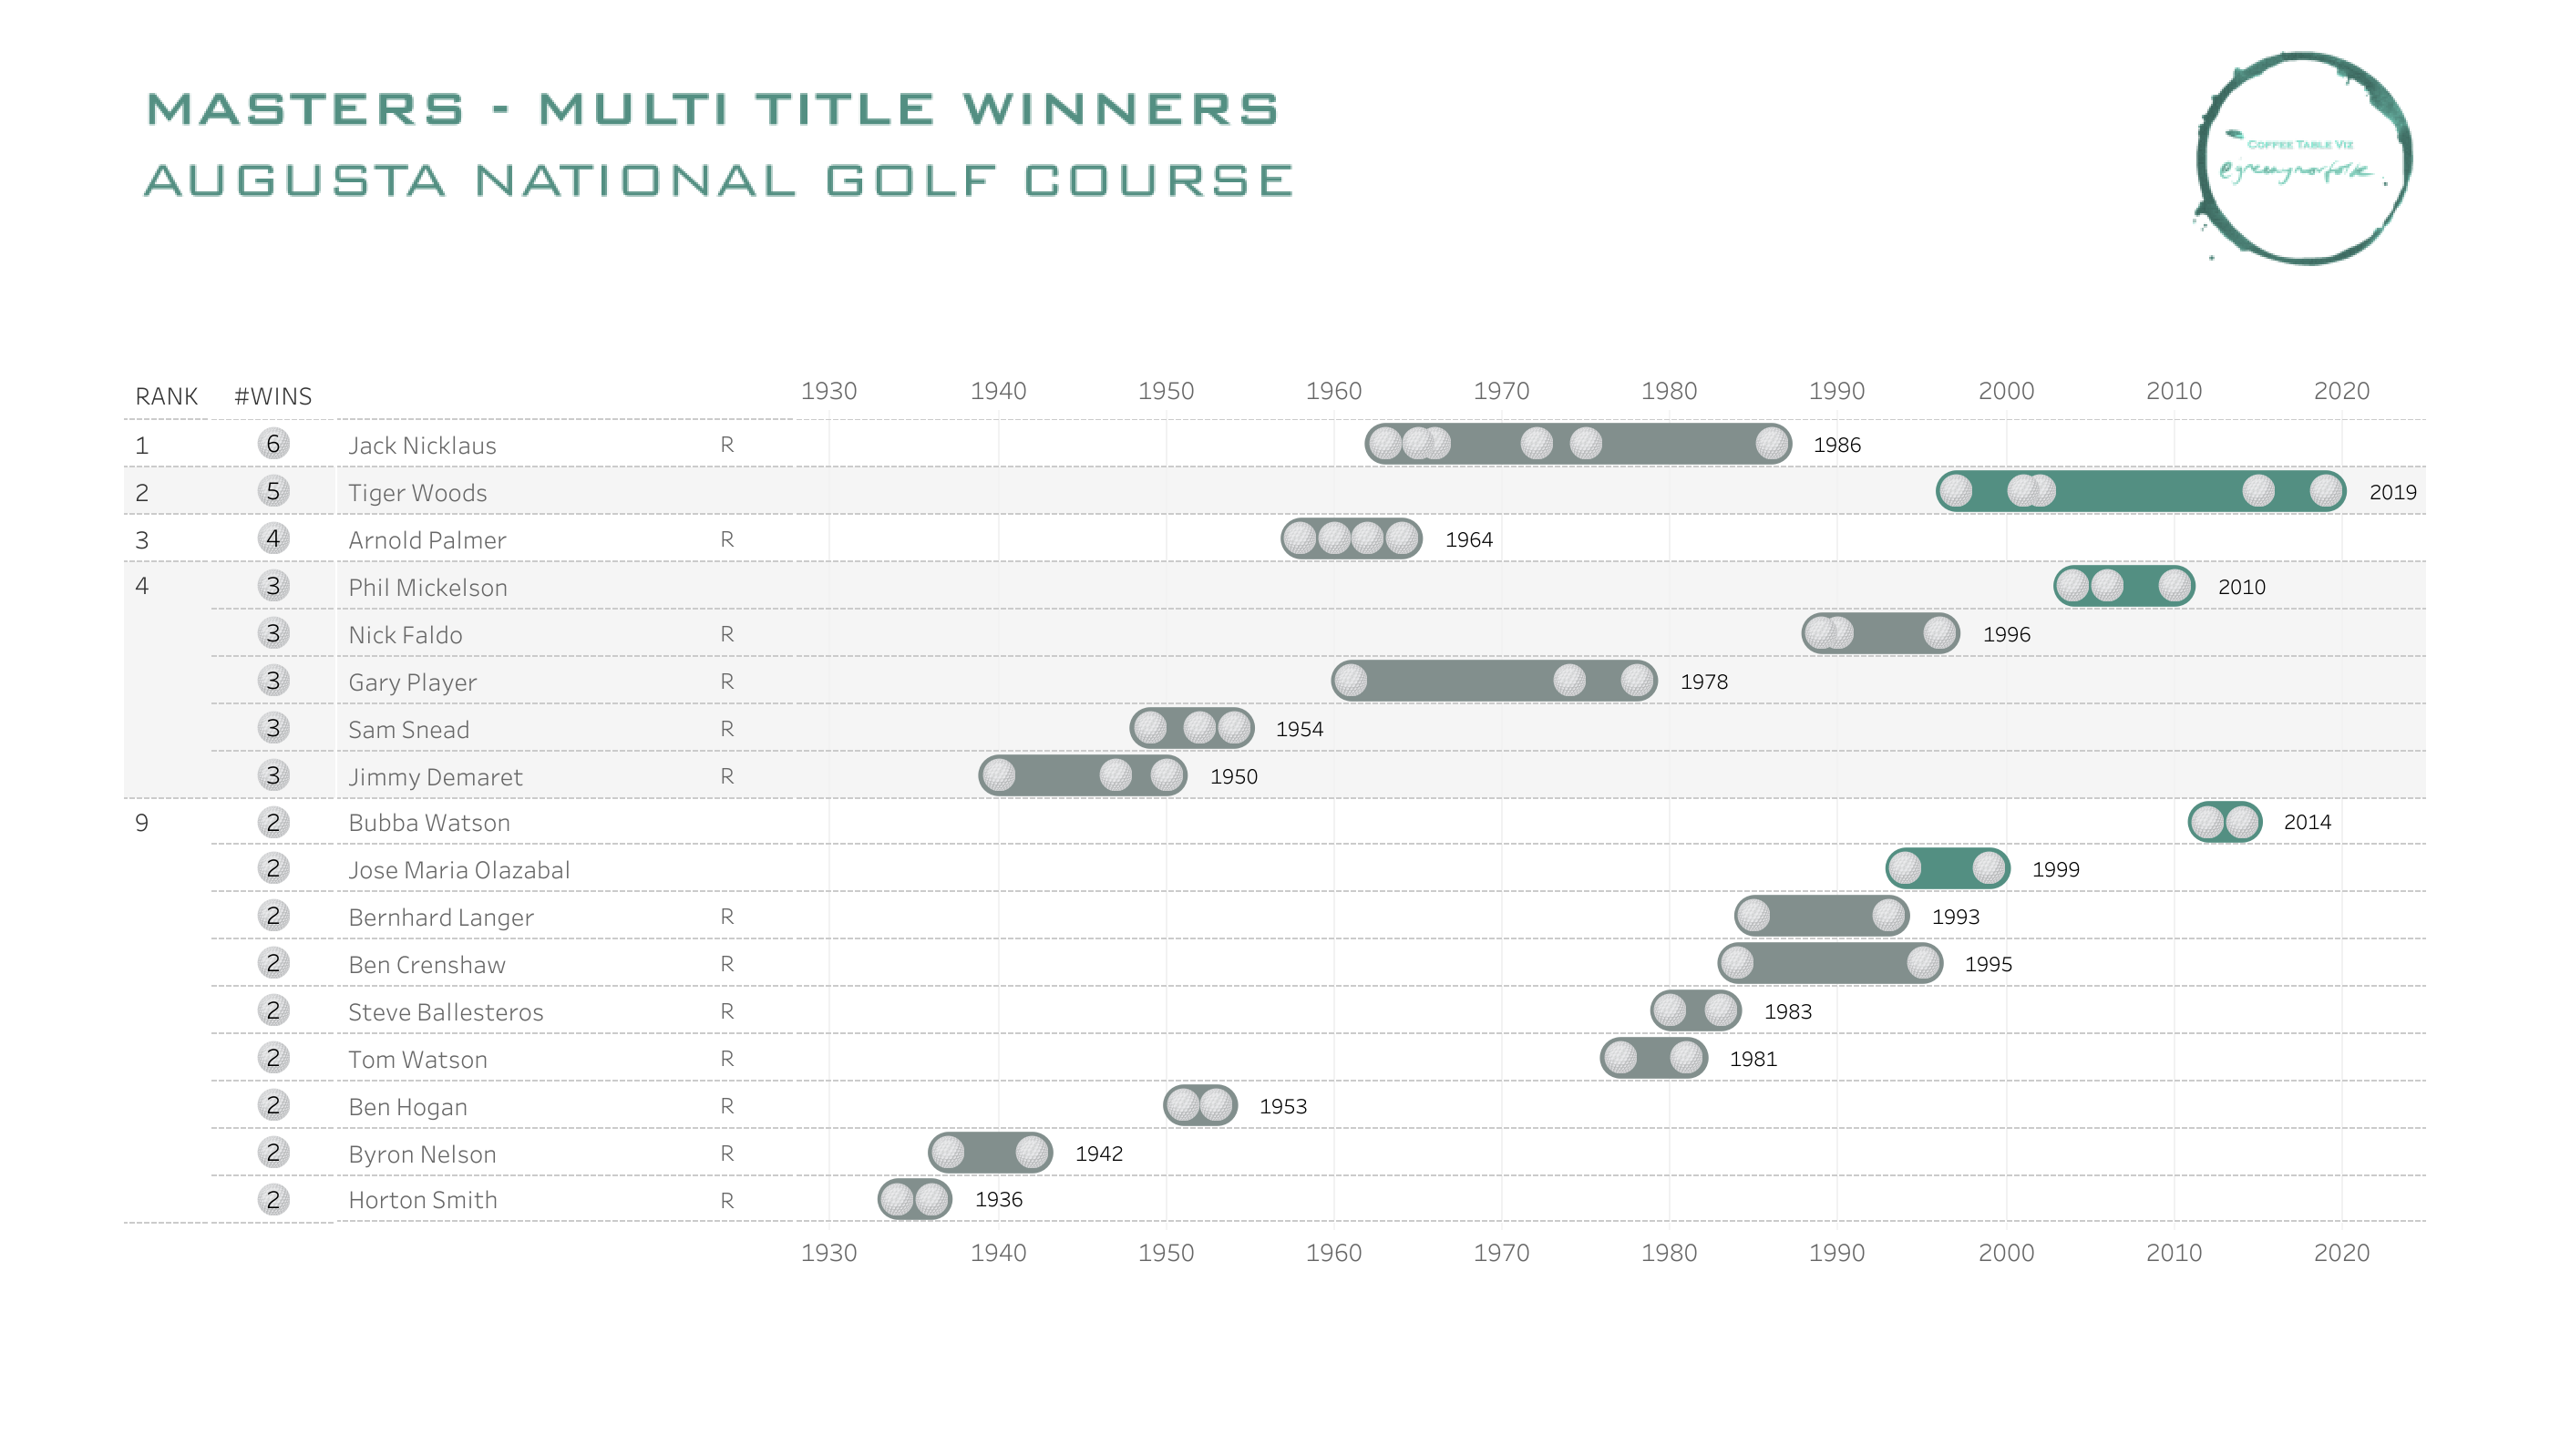
Below we have a table of Golf’s Masters tournament multiple winners .
*Note since originally pulling this data and publishing the viz in 2023 Scottie Scheffler would be added to this table and associated viz
Scottie Scheffler — 2022, 2024
The table
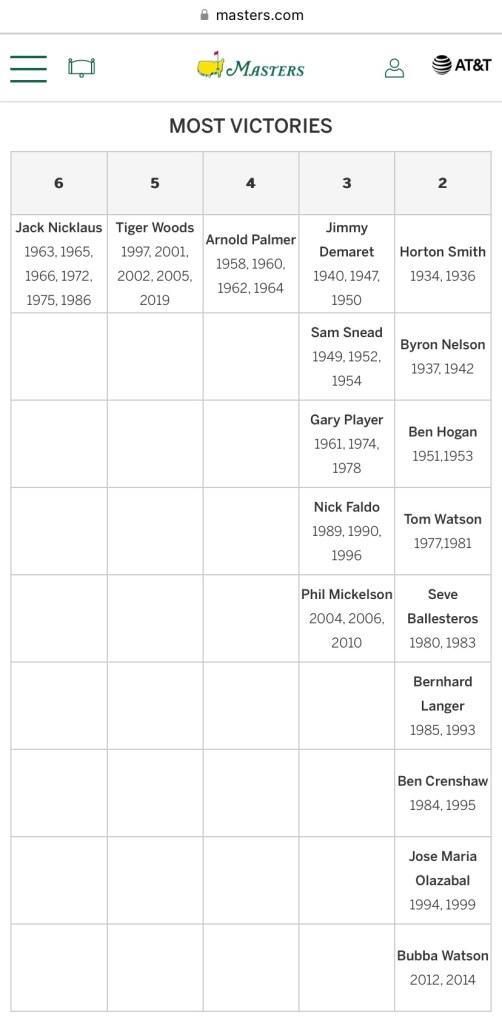
To be honest I didn’t need any more than the raw data, it was fairly accessible and I was able to extract the precise figures I needed from that data table. And I could see the comparison between the distribution of # players whom have had 2 or more multiple wins versus the rare 4,5 and 6 multiple wins. However, not a lot else. But, maybe the masters.com data creators intention is just that? – the information provider! For that – ta muchly!
The viz
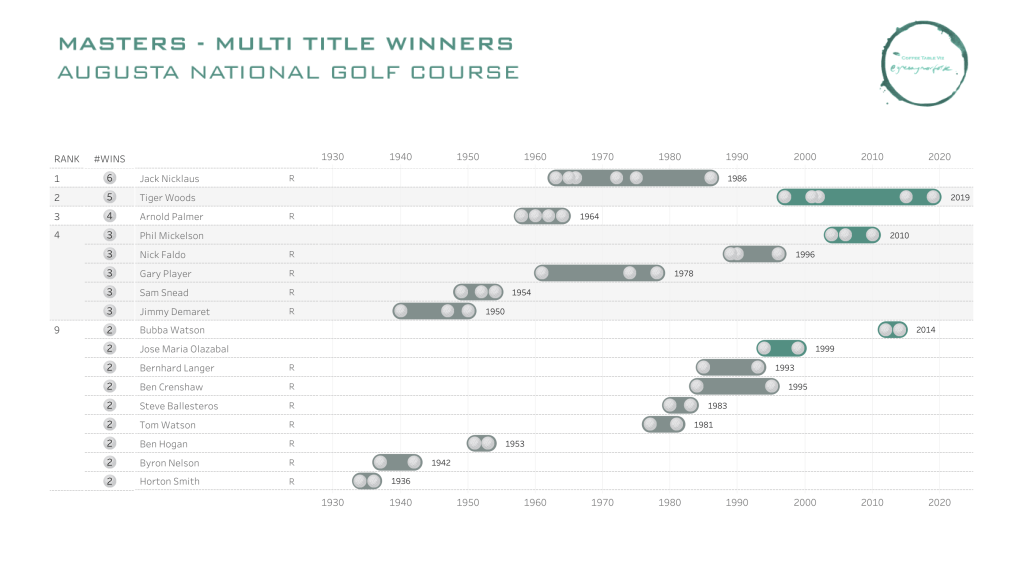
In this visualisation I have attempted to enhance the comprehension of the data inherent in the table, firstly by plotting the dates on a continuous timeline, highlighting when a player achieved those multiple wins. Visually presenting these wins not only is more engaging but also contextualises these wins to over time and gives us a greater comprehension of the players wins over their career. Visually showing this context highlights the rarity of the back to back wins (insight), comparing between players and detecting these exceptional data anomalies in the golfing Augusta calendar.
TL;DR
Ultimately, as the witty saga of data unfolds in the delicate dance between these two contenders. It’s not about choosing sides but recognising that each plays a vital role in the grand data opera. So, whether you’re a data table traditionalist or a data visualisation virtuoso, in our wonderful world of data, it’s not about tables versus visuals—it’s about providing what’s needed to whom at the right time, sometimes that’s information, sometimes that’s insights and sometimes that’s a story!
Thanks for reading, ping me with any thoughts or questions.
Adam
First published on the original coffeetableviz WordPress site.